
 429
429
Overview
Want a quick snapshot of your business performance? The KPI Performance Report in Core is the Key Performance Statistics summarizing business performance across multiple business reporting arms. This guide shows you how to generate a KPI Performance Report using the Reports section in Hapana Core.
Prerequisites
Before you start, make sure you:
-
Have access to the Hapana Core Dashboard
-
Have permission to view Reports and Financial data
-
Know the reporting period you want to filter
How to generate the KPI Performance Report
Step 1: Navigate to Financial Reports
-
Log into your Hapana Core Account.
-
Click on the Reports tab from the main navigation.
-
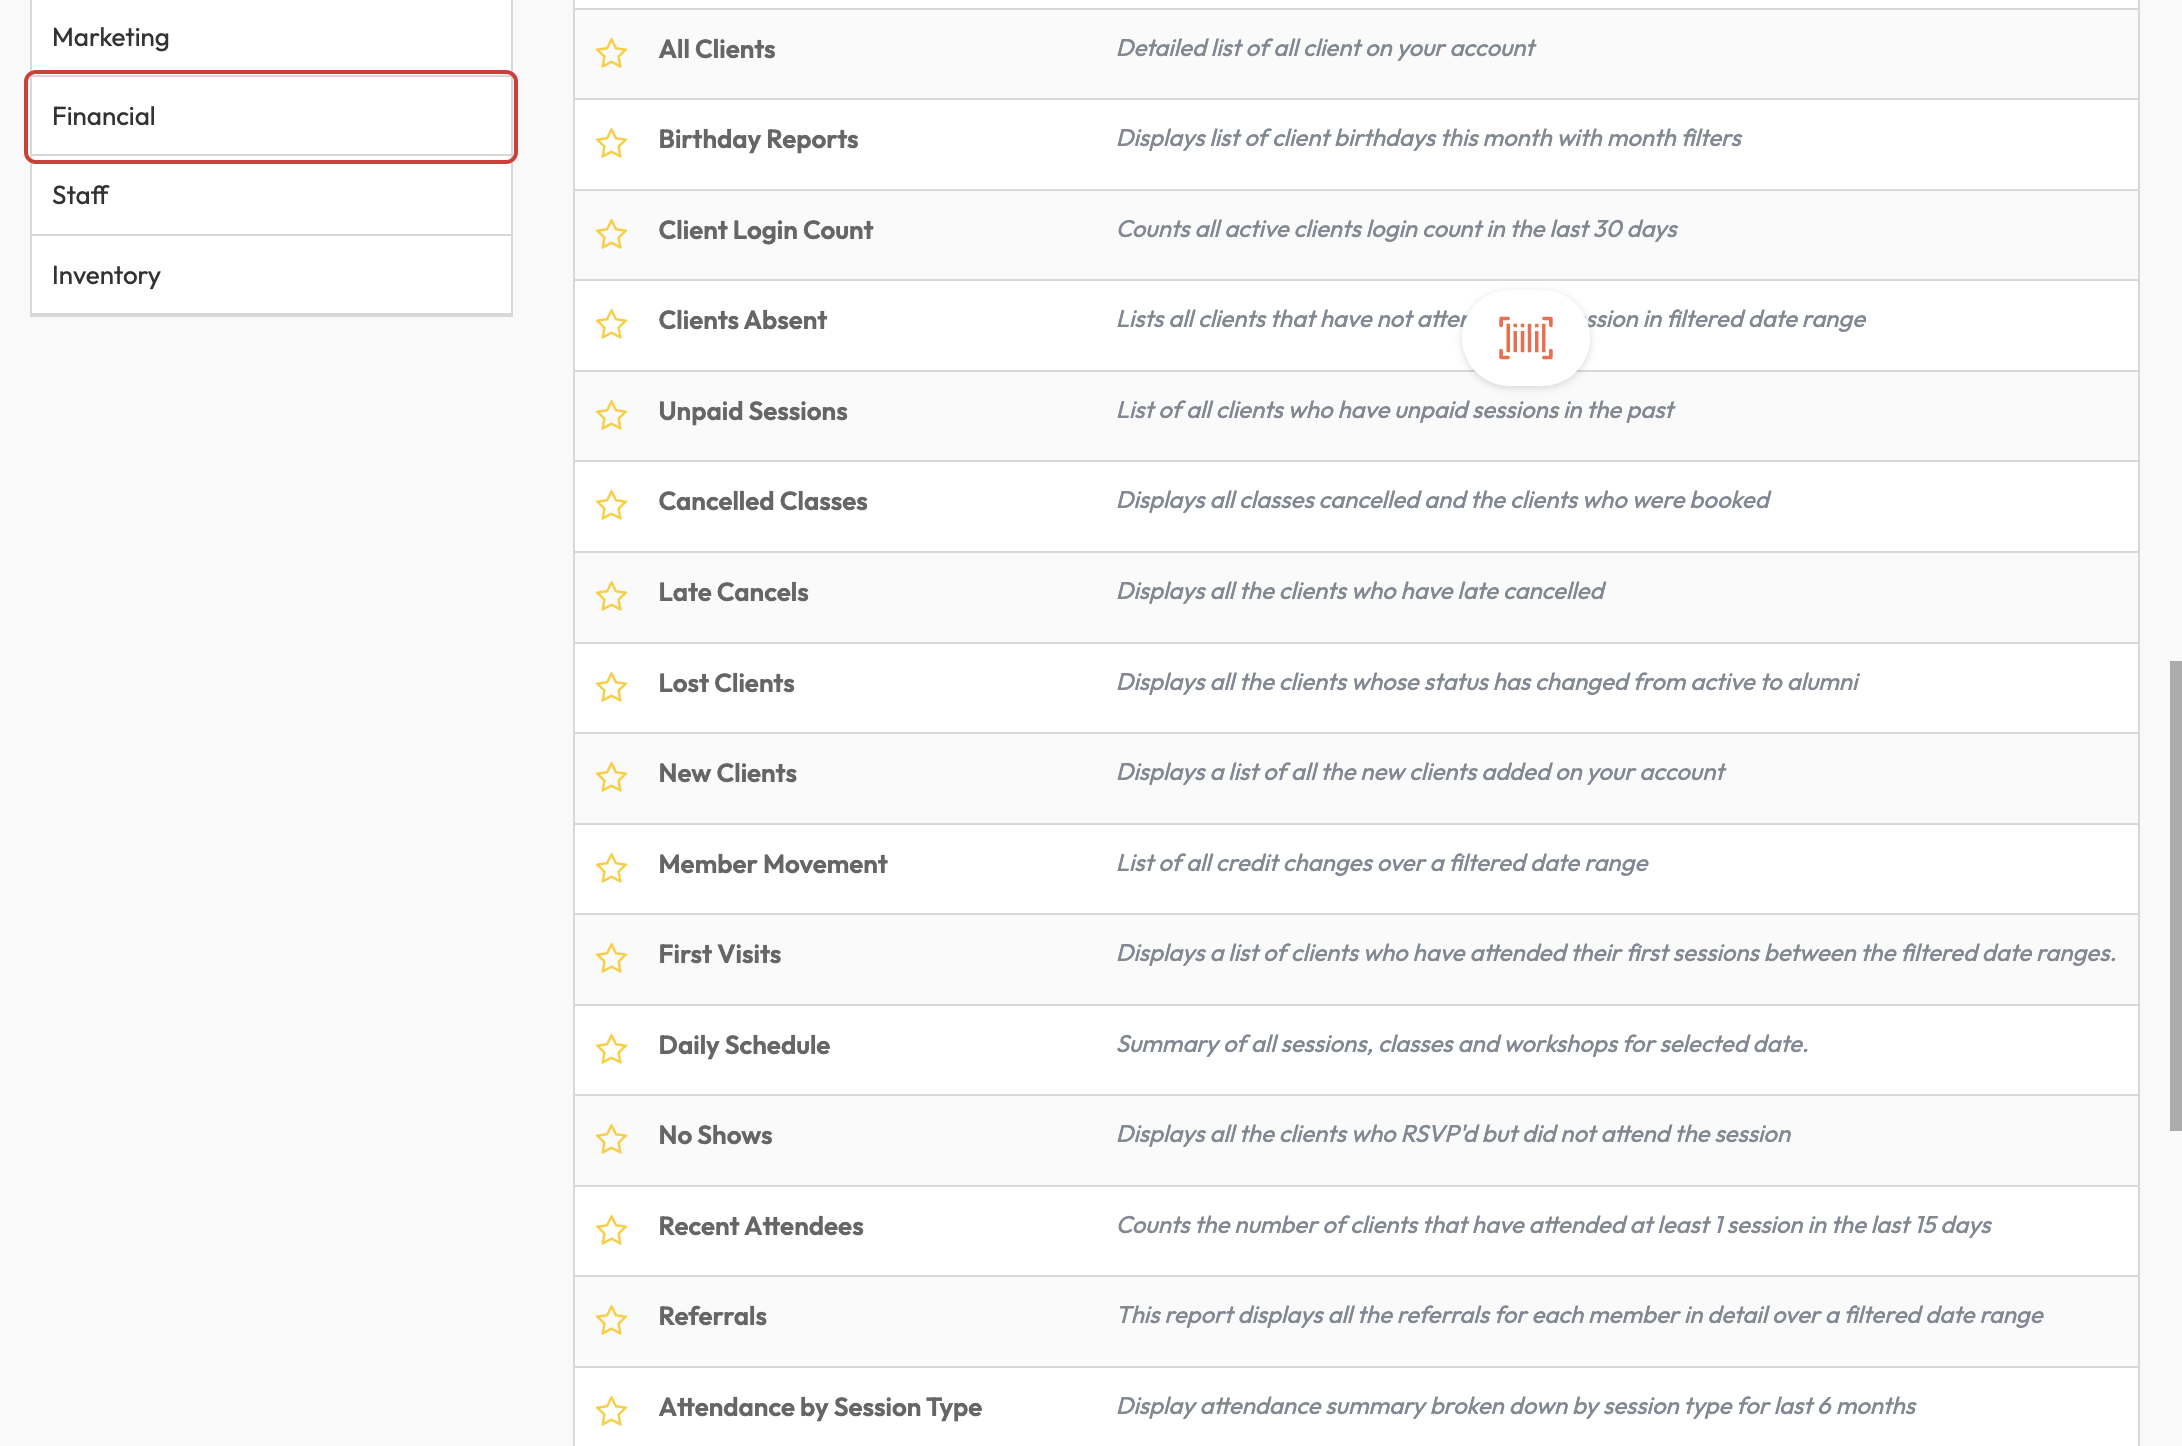
In the left-side menu, click Financial under the Reports section.
Step 2: Open KPI Performance Report
-
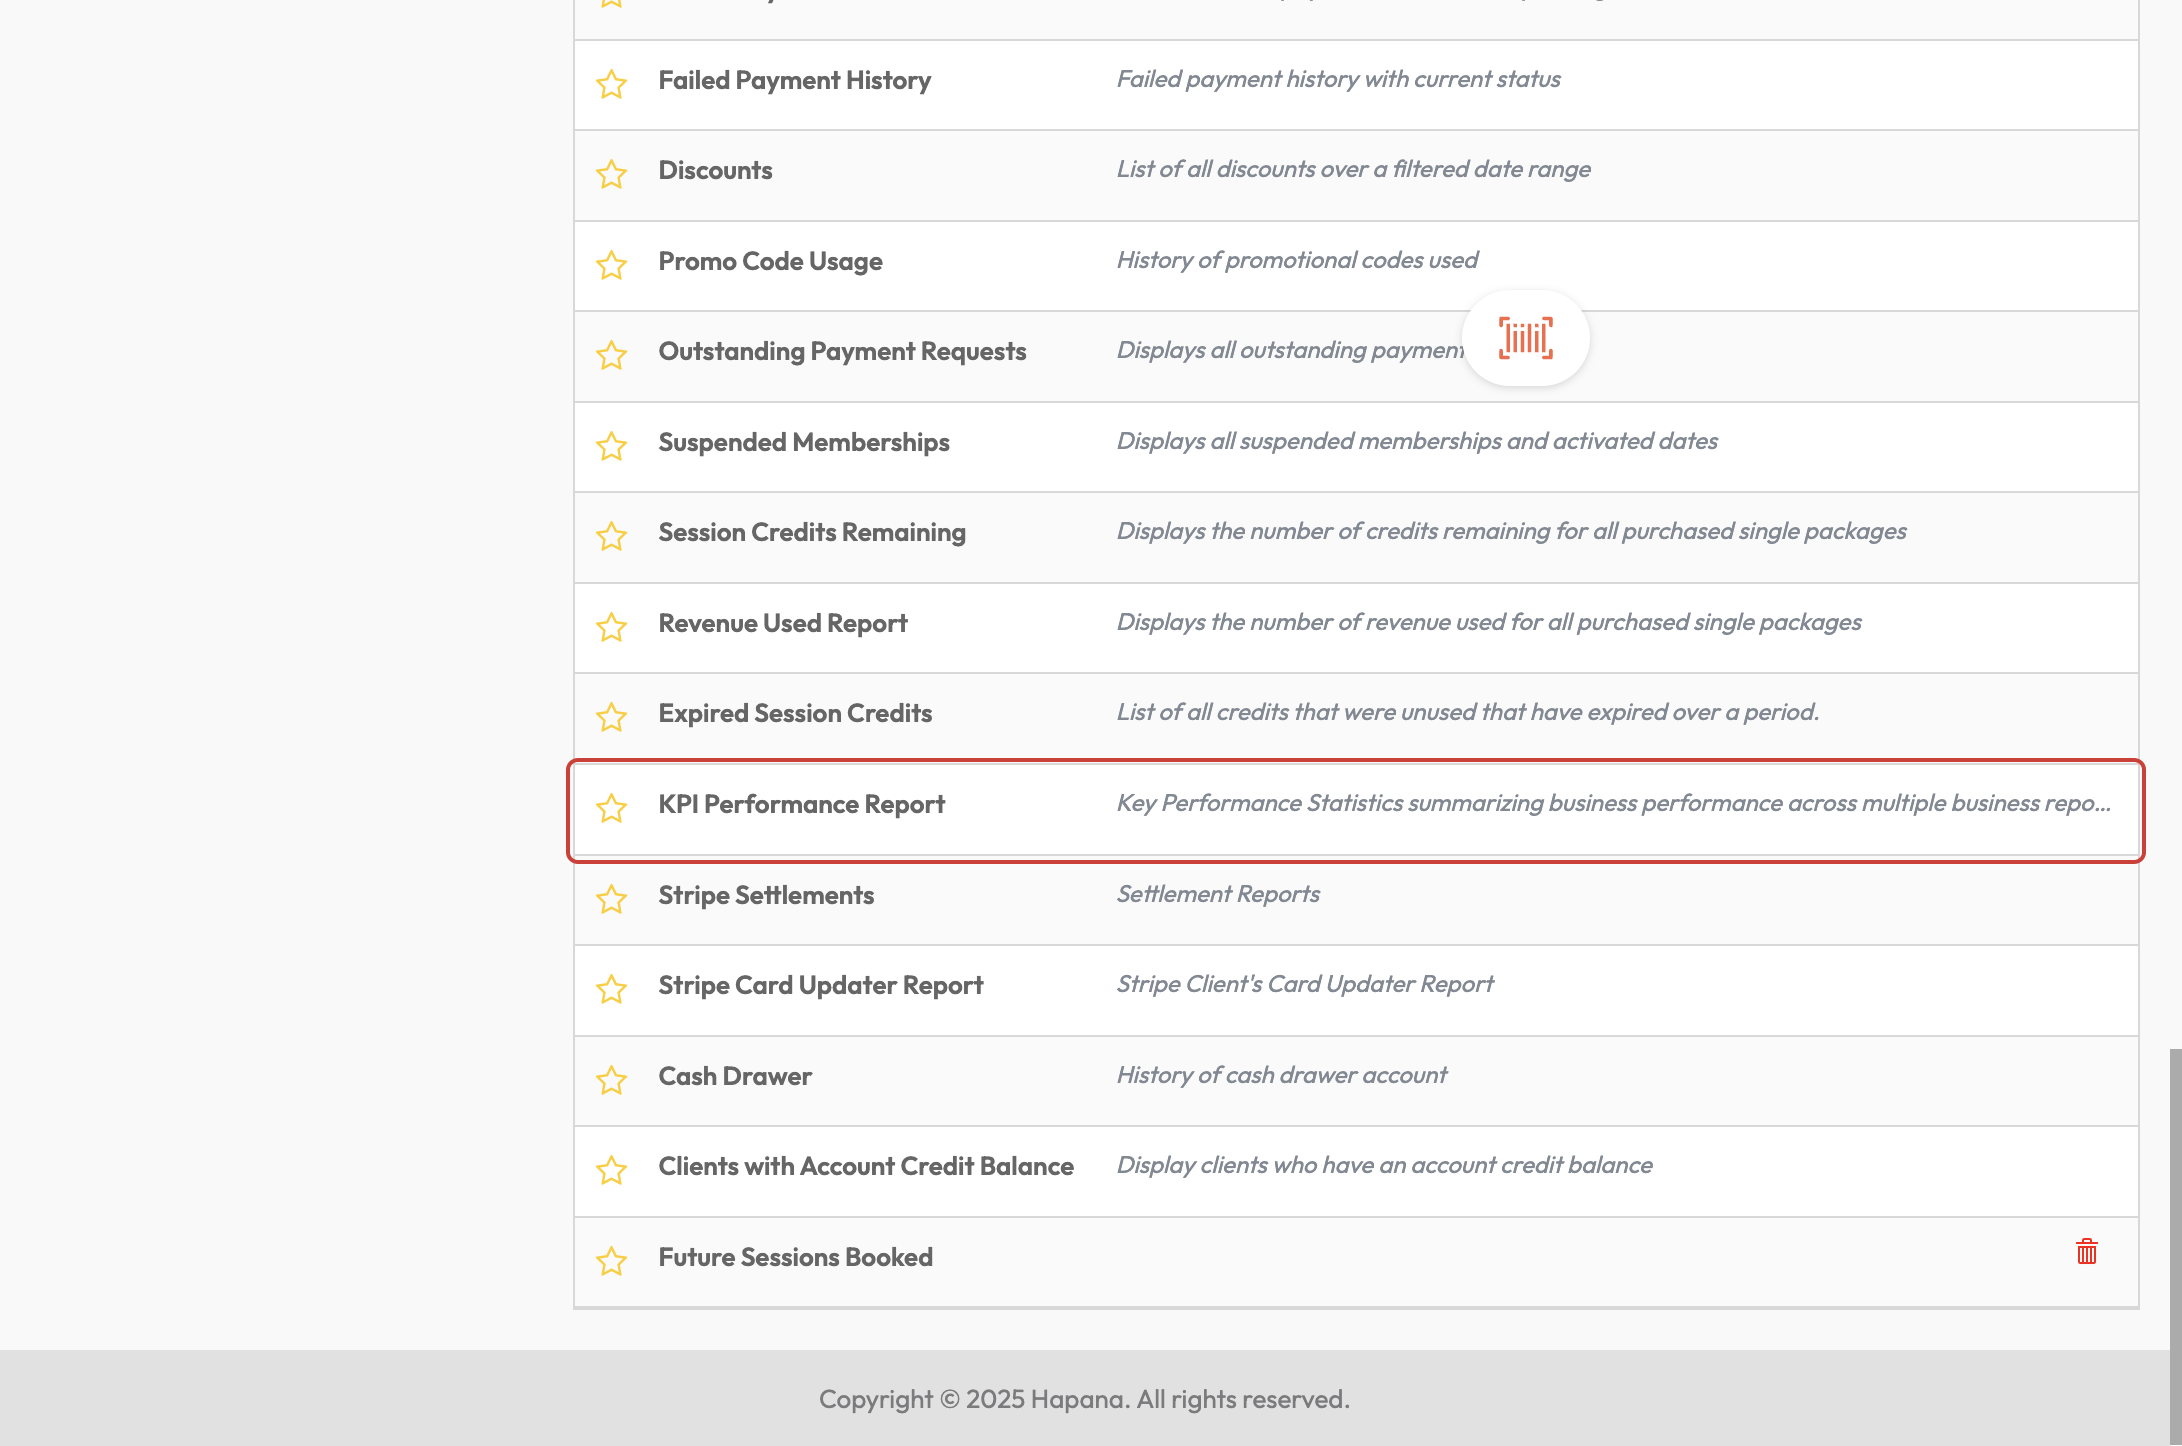
From the list of financial reports, click KPI Performance Report.
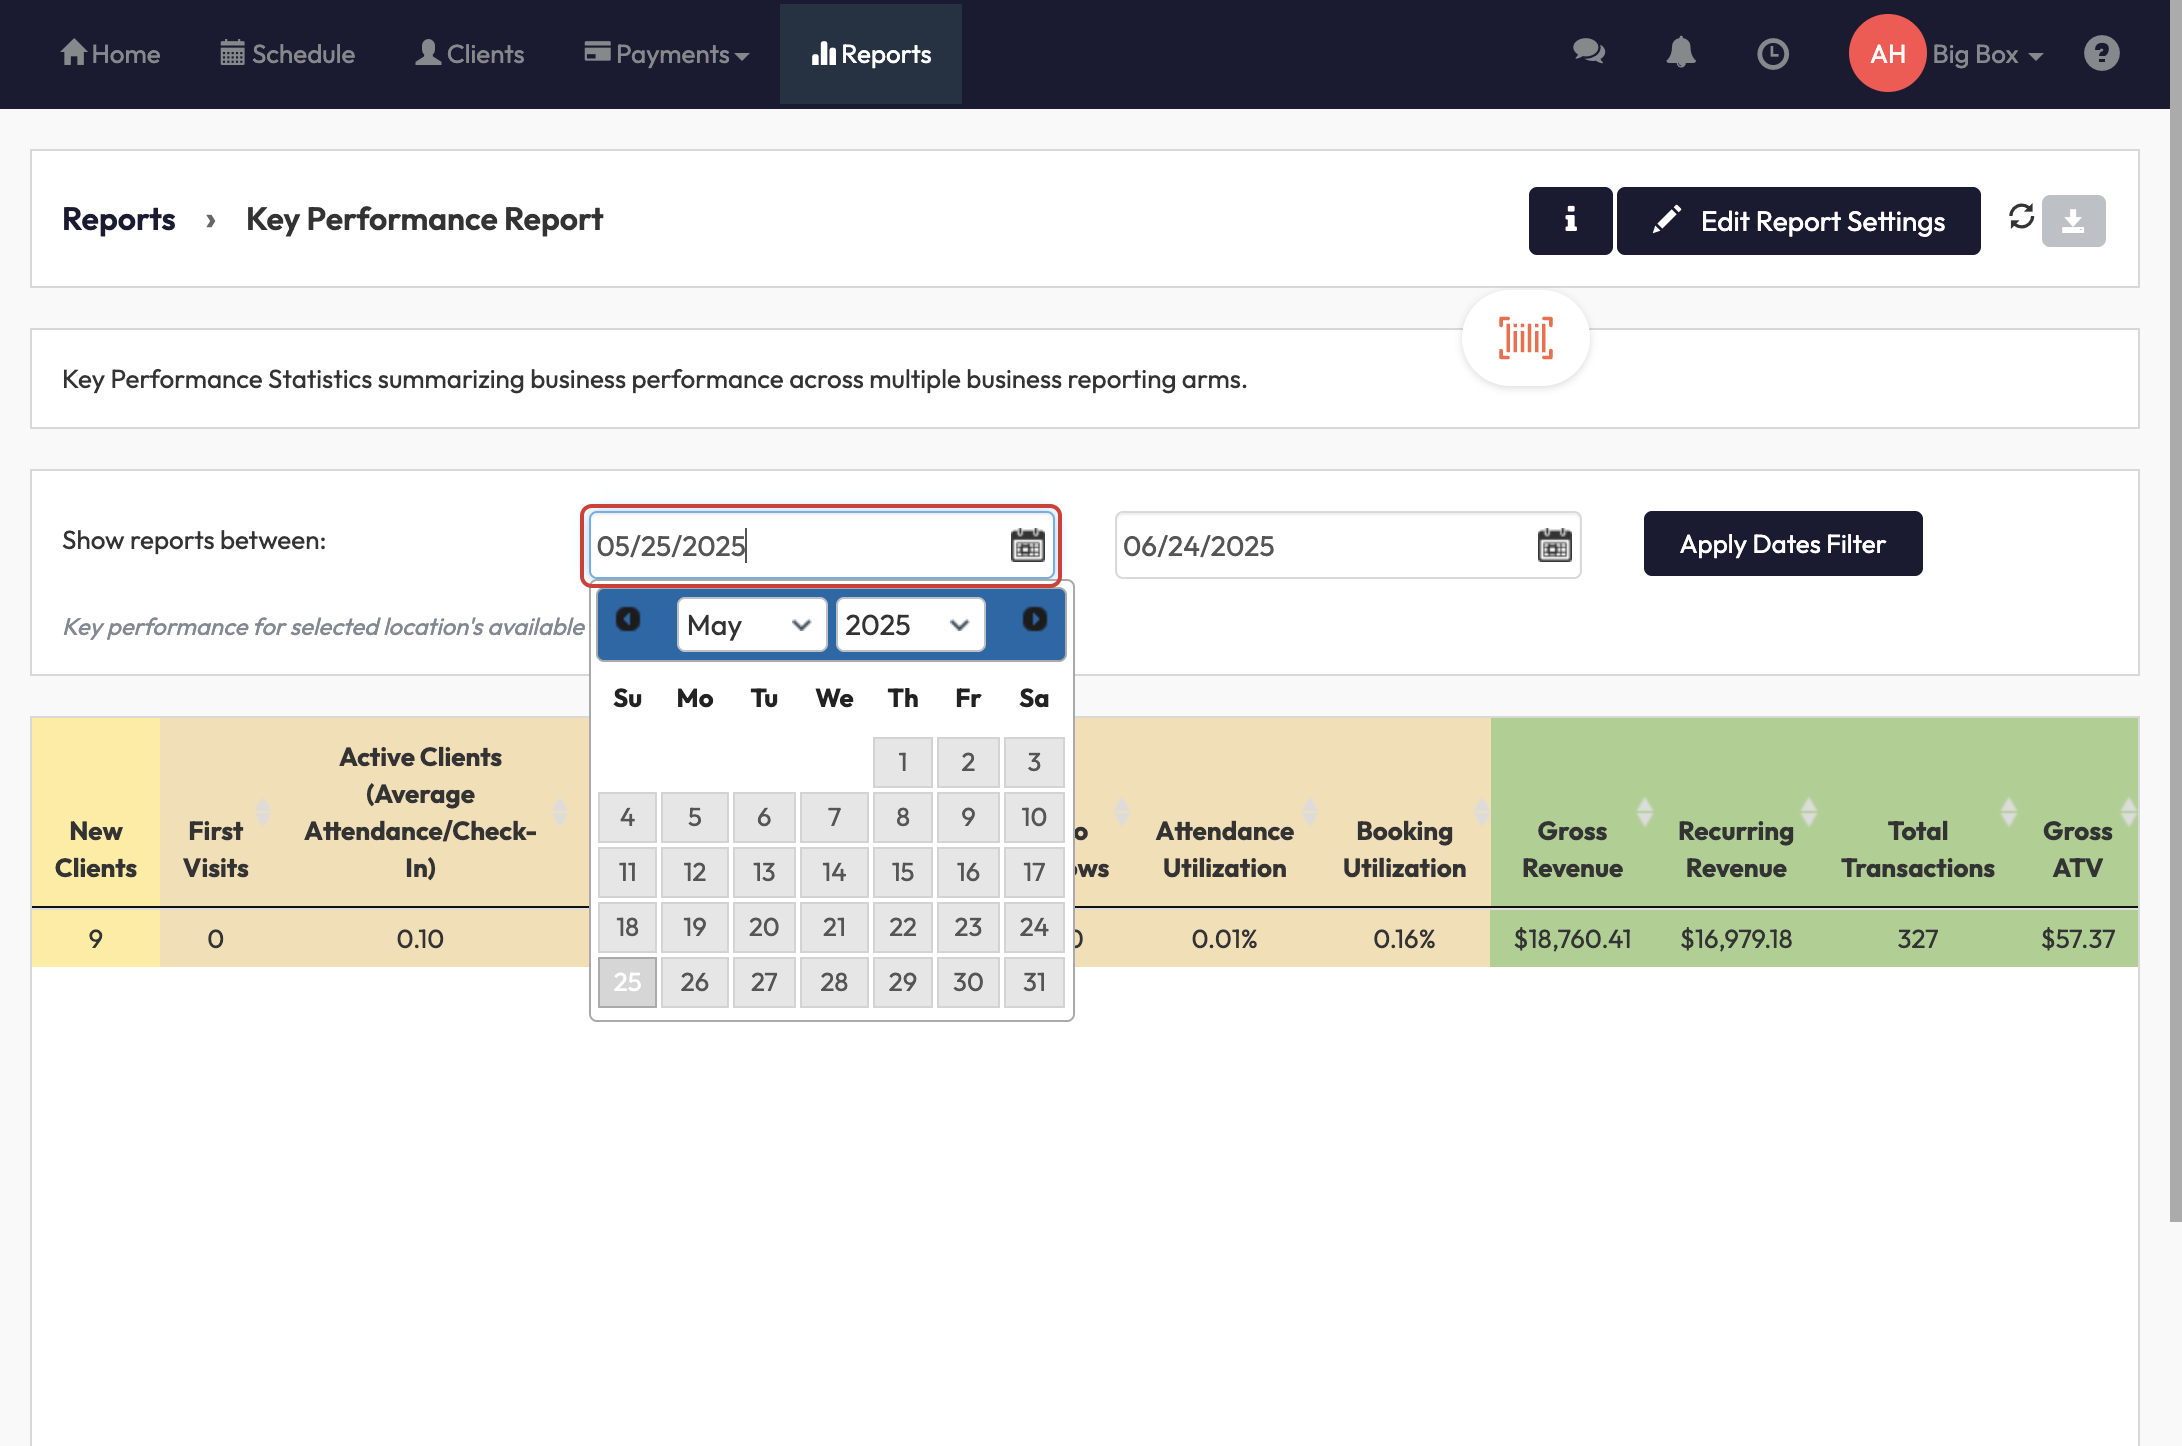
Step 3: Set the Date Range
-
Go to 'Show reports between' to select the desired date range.
-
Click Apply Dates Filter to confirm.
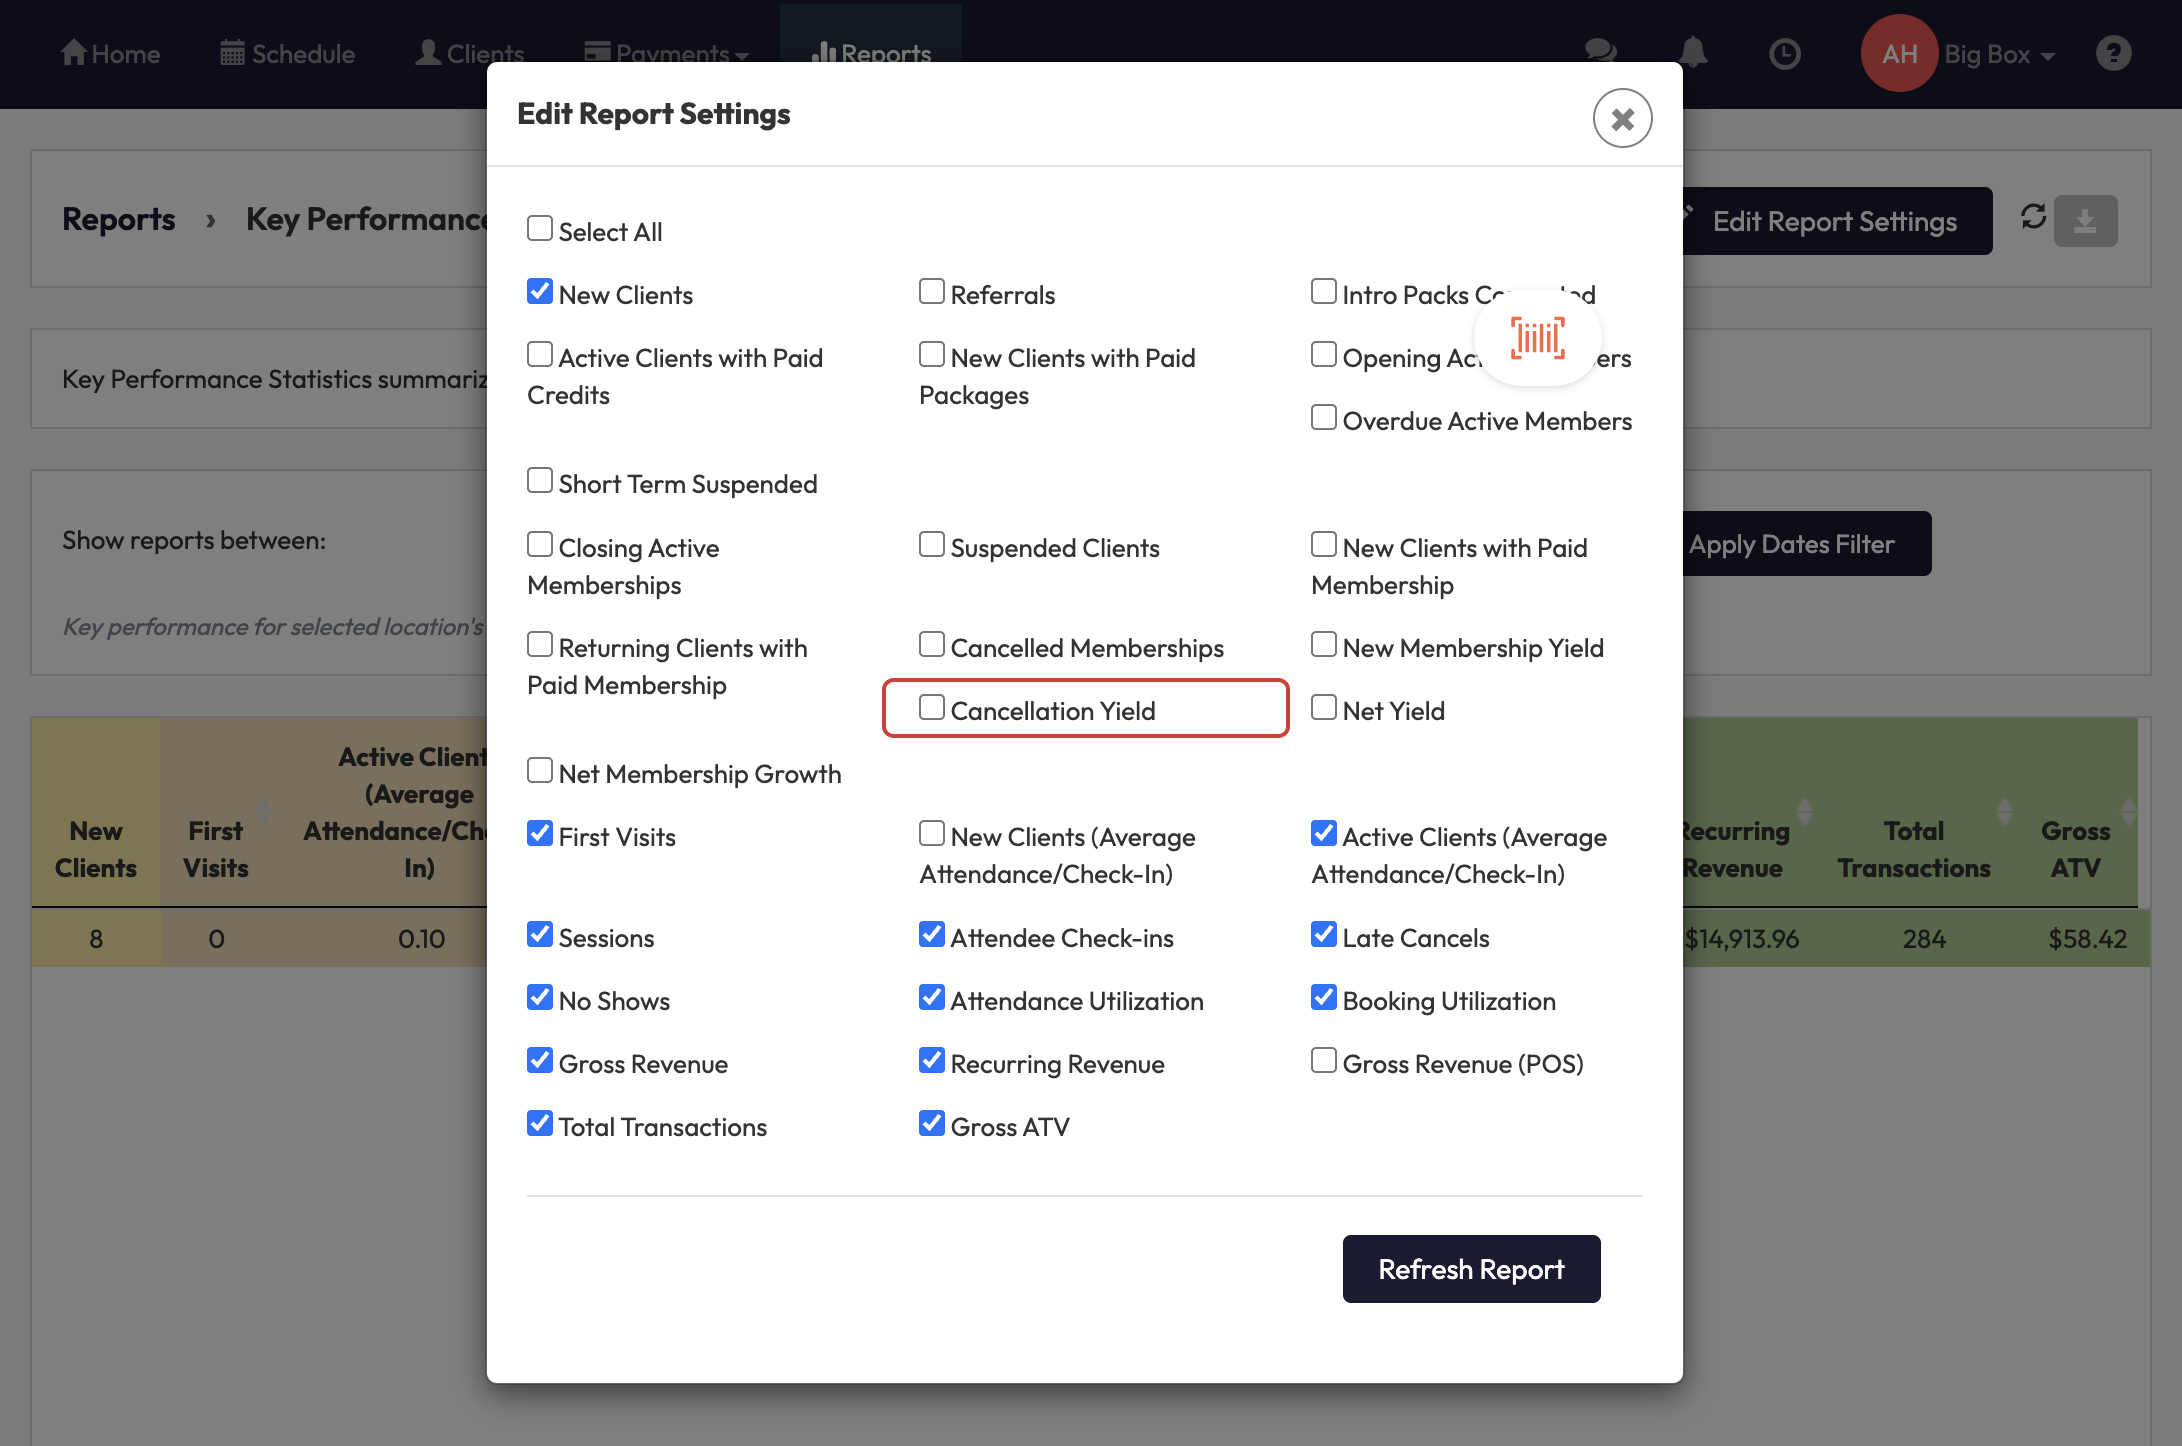
Step 4: Edit Report Settings
-
Click on Edit Report Settings (top-right).
-
In the popup, review and check the relevant display options to customize what data shows in your report.
-
Click Refresh Report to load the updated data.
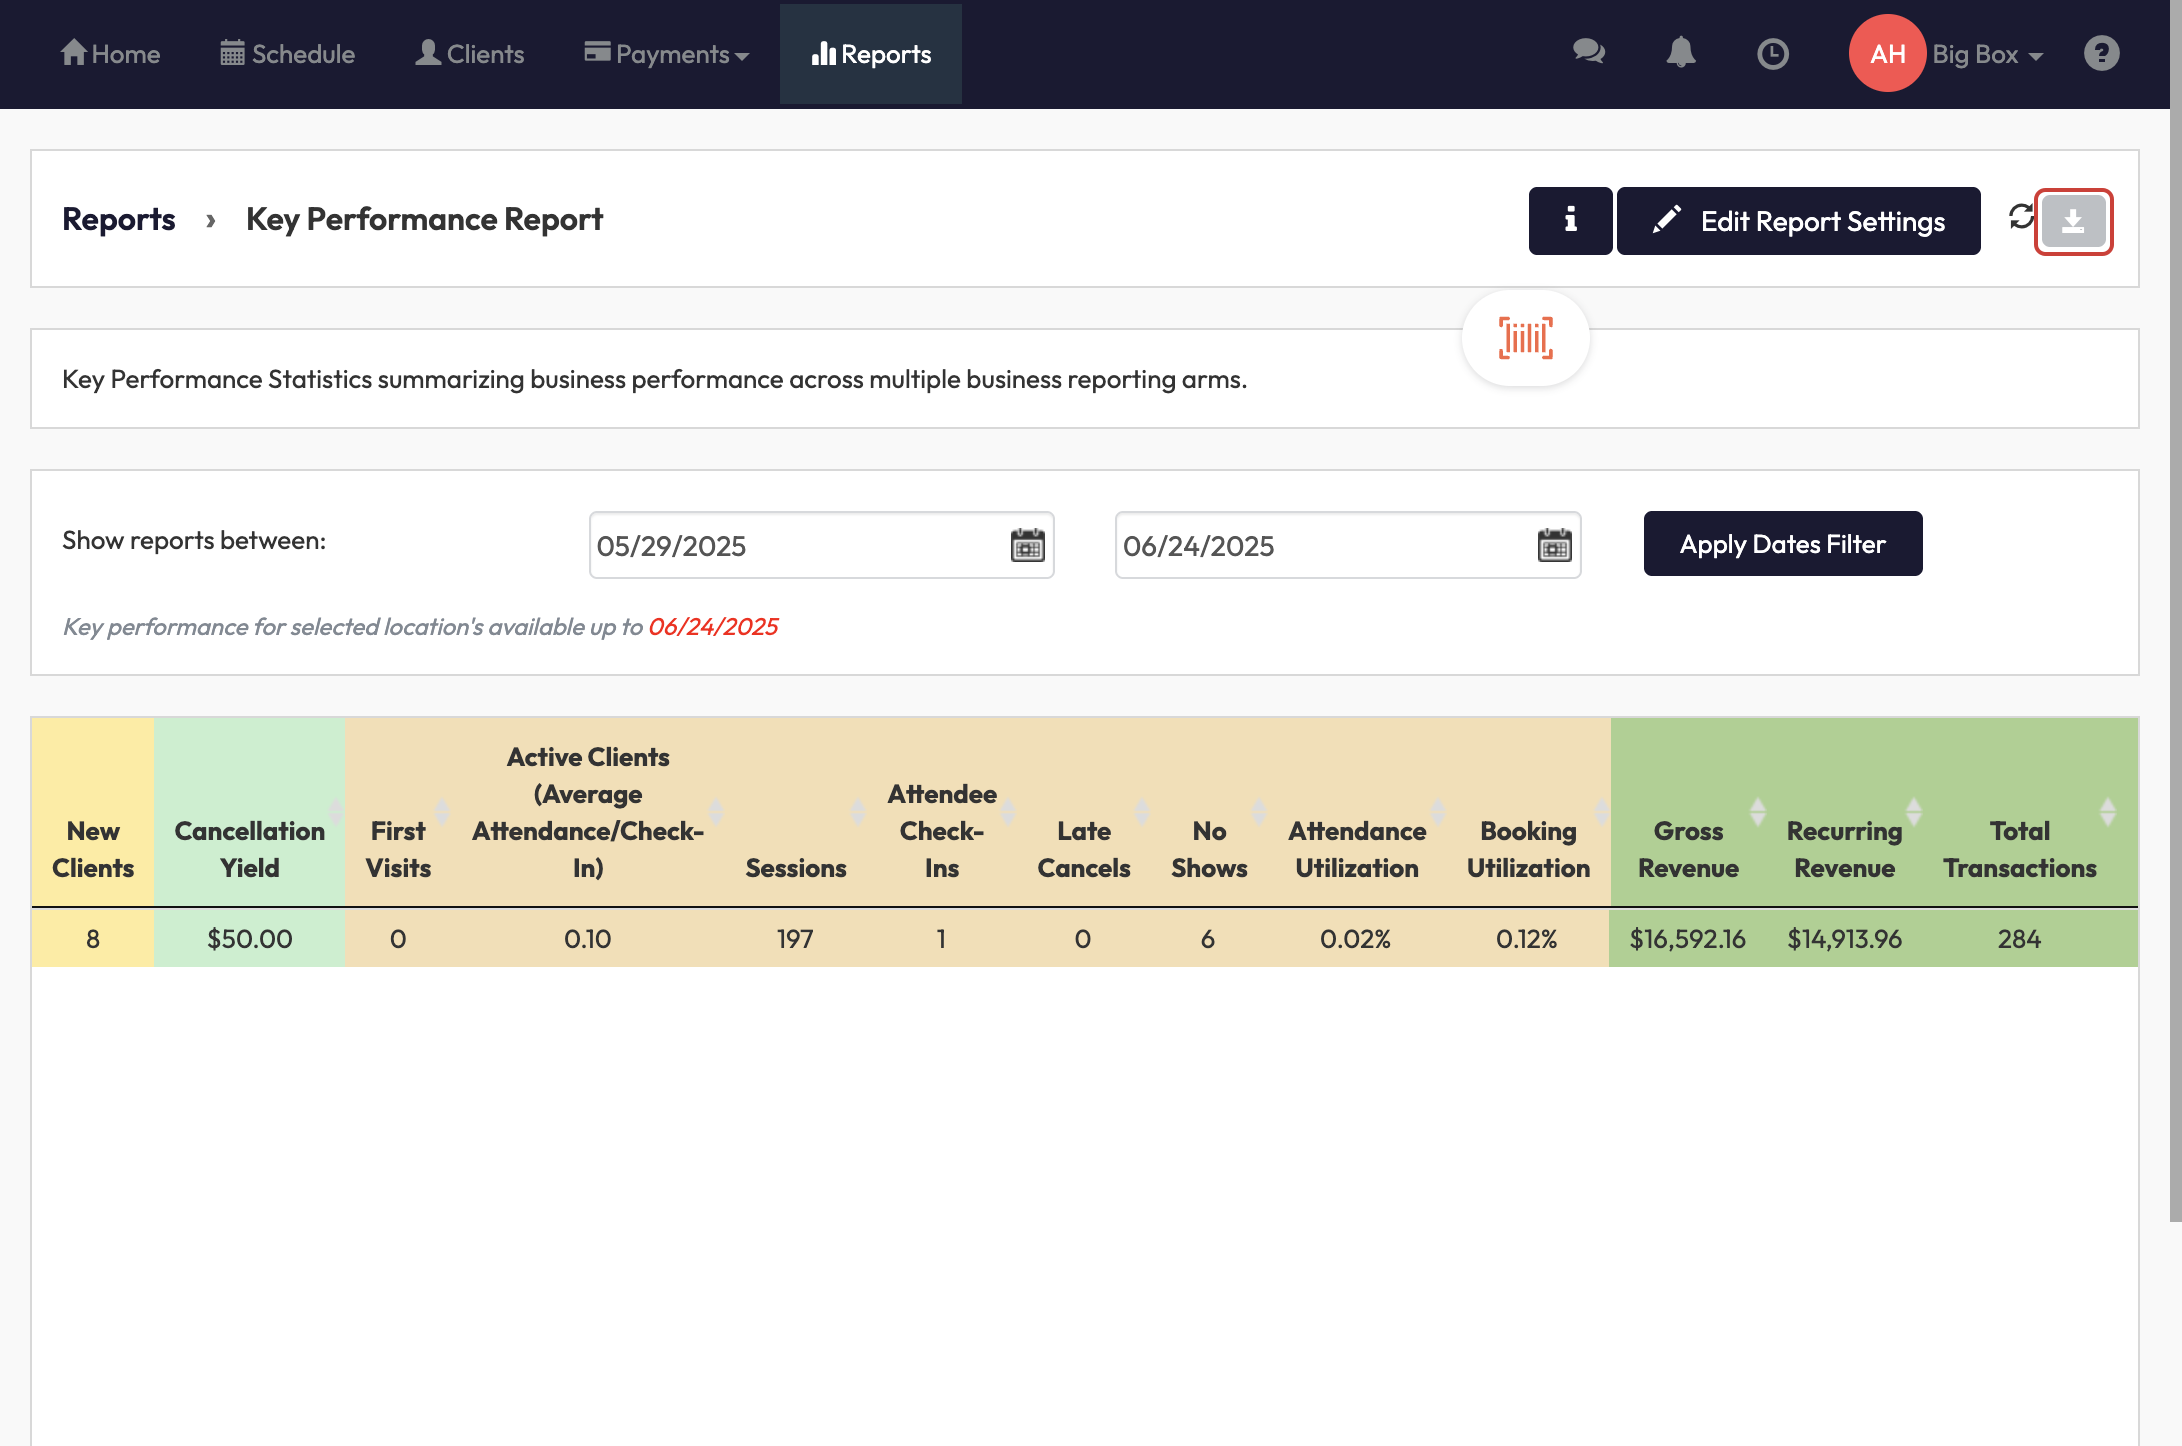
Step 5: Download as CSV
-
Click the grey 'Download report' button to download report as CSV.
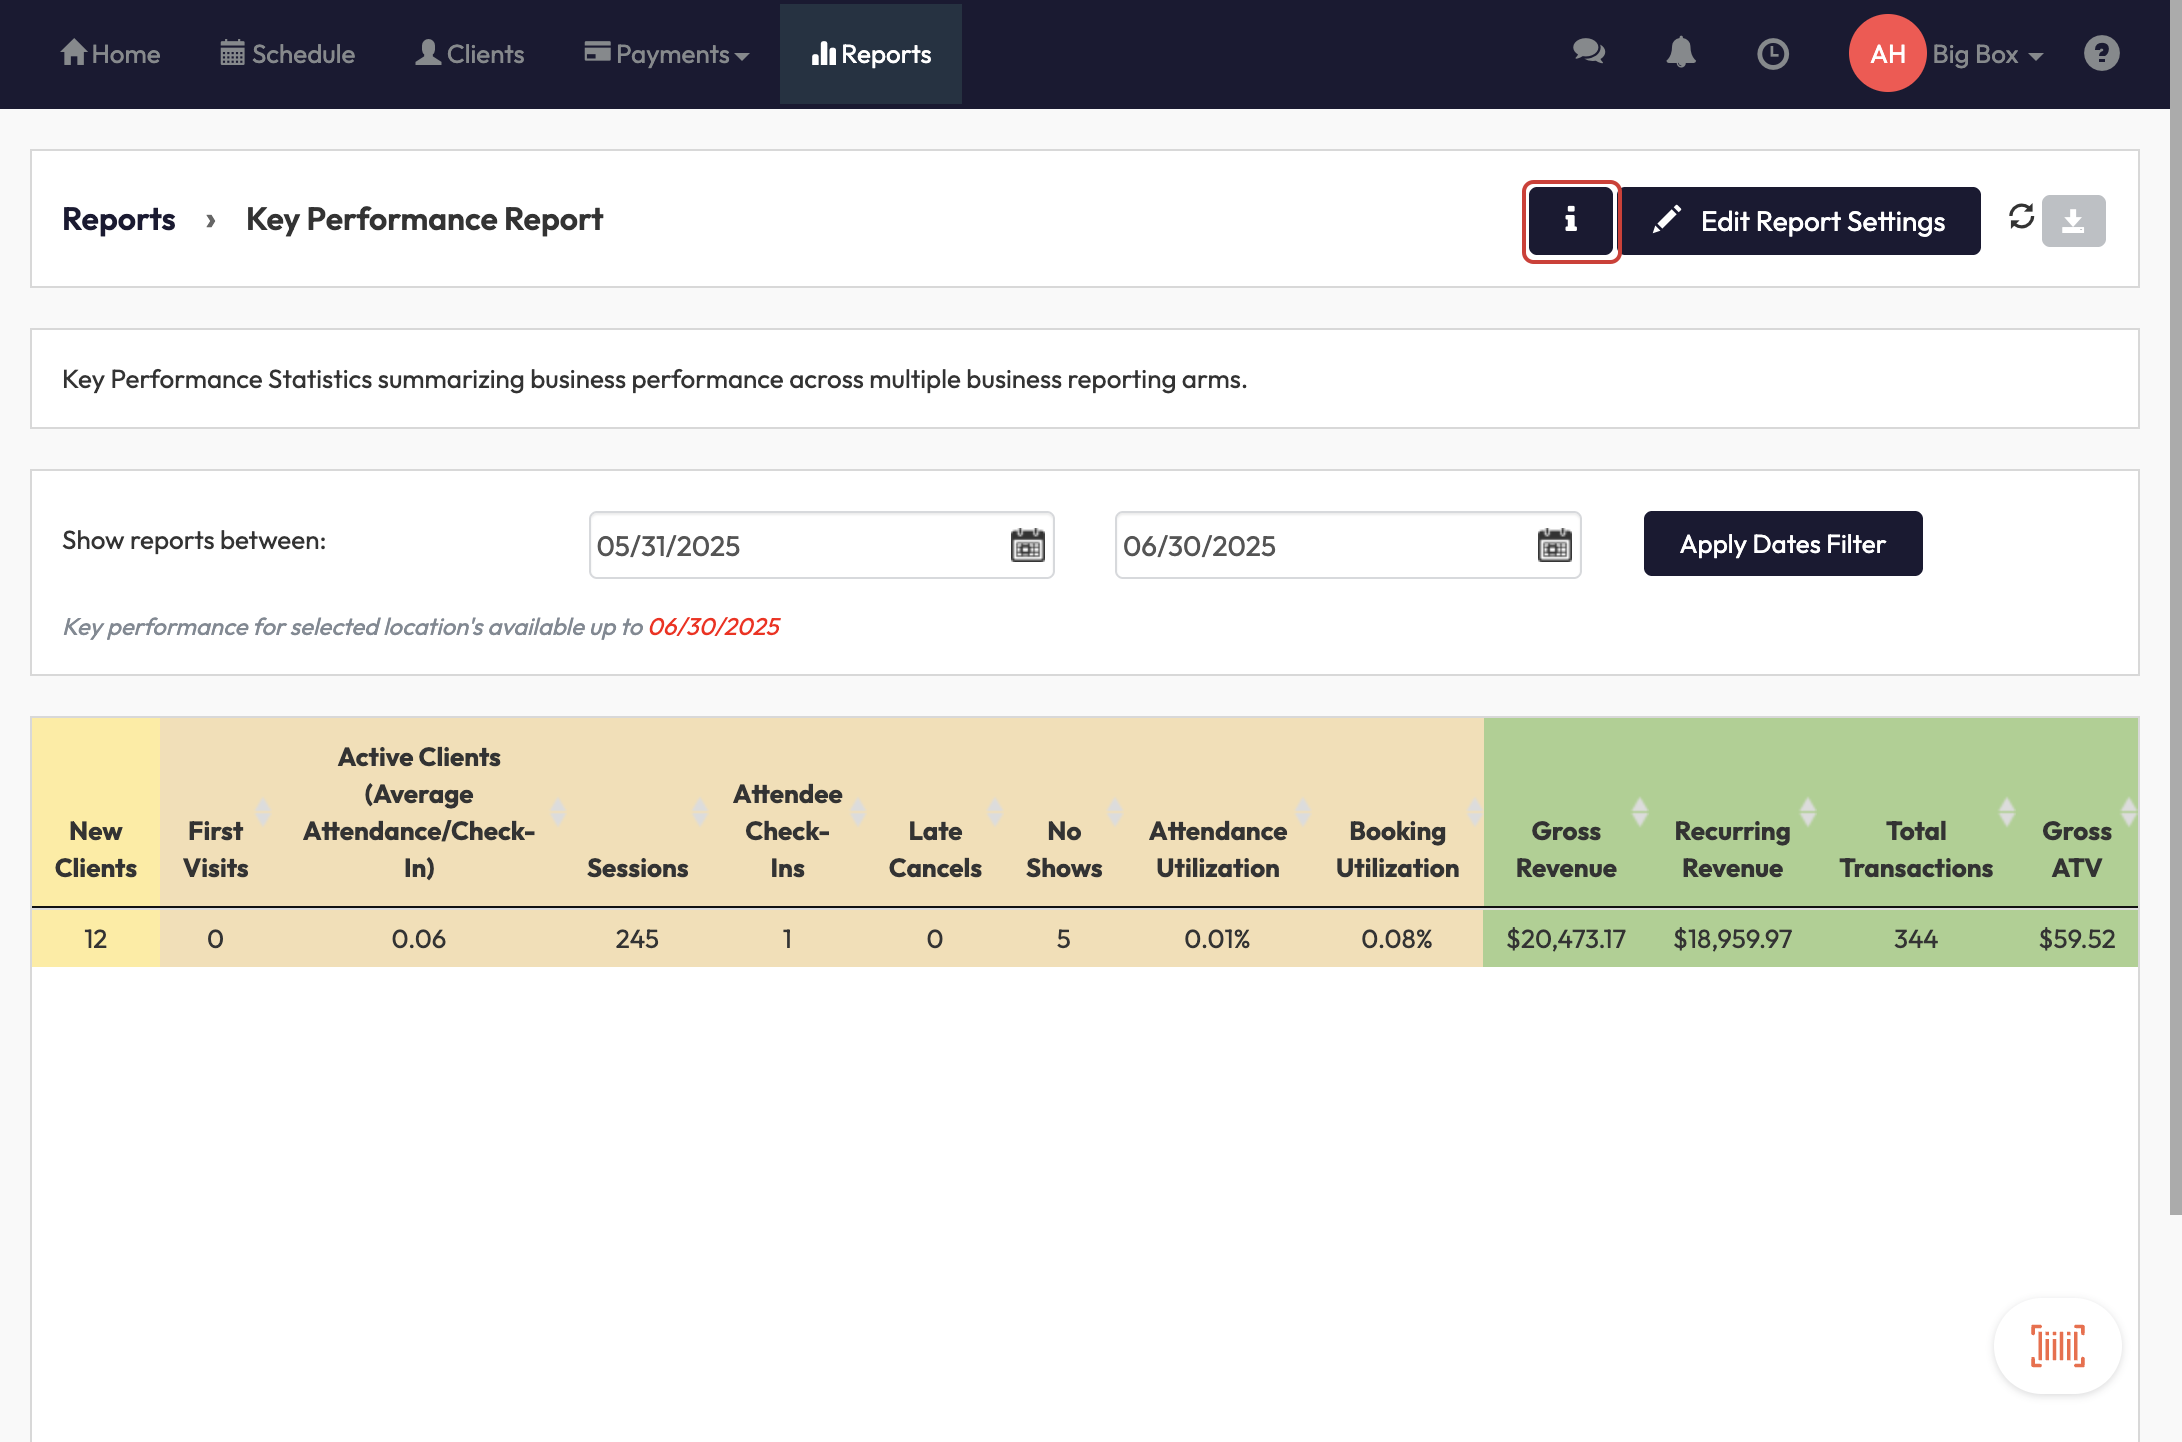
How to View Column Details
The Column Details displays the logic associated with each column name in the KPI Performance Report.
- Navigate to Reports > Financial > Key Performance Report.
- Click the 'i' icon to view the Column Details as highlighted in the image below.
Column Details shown in platform:
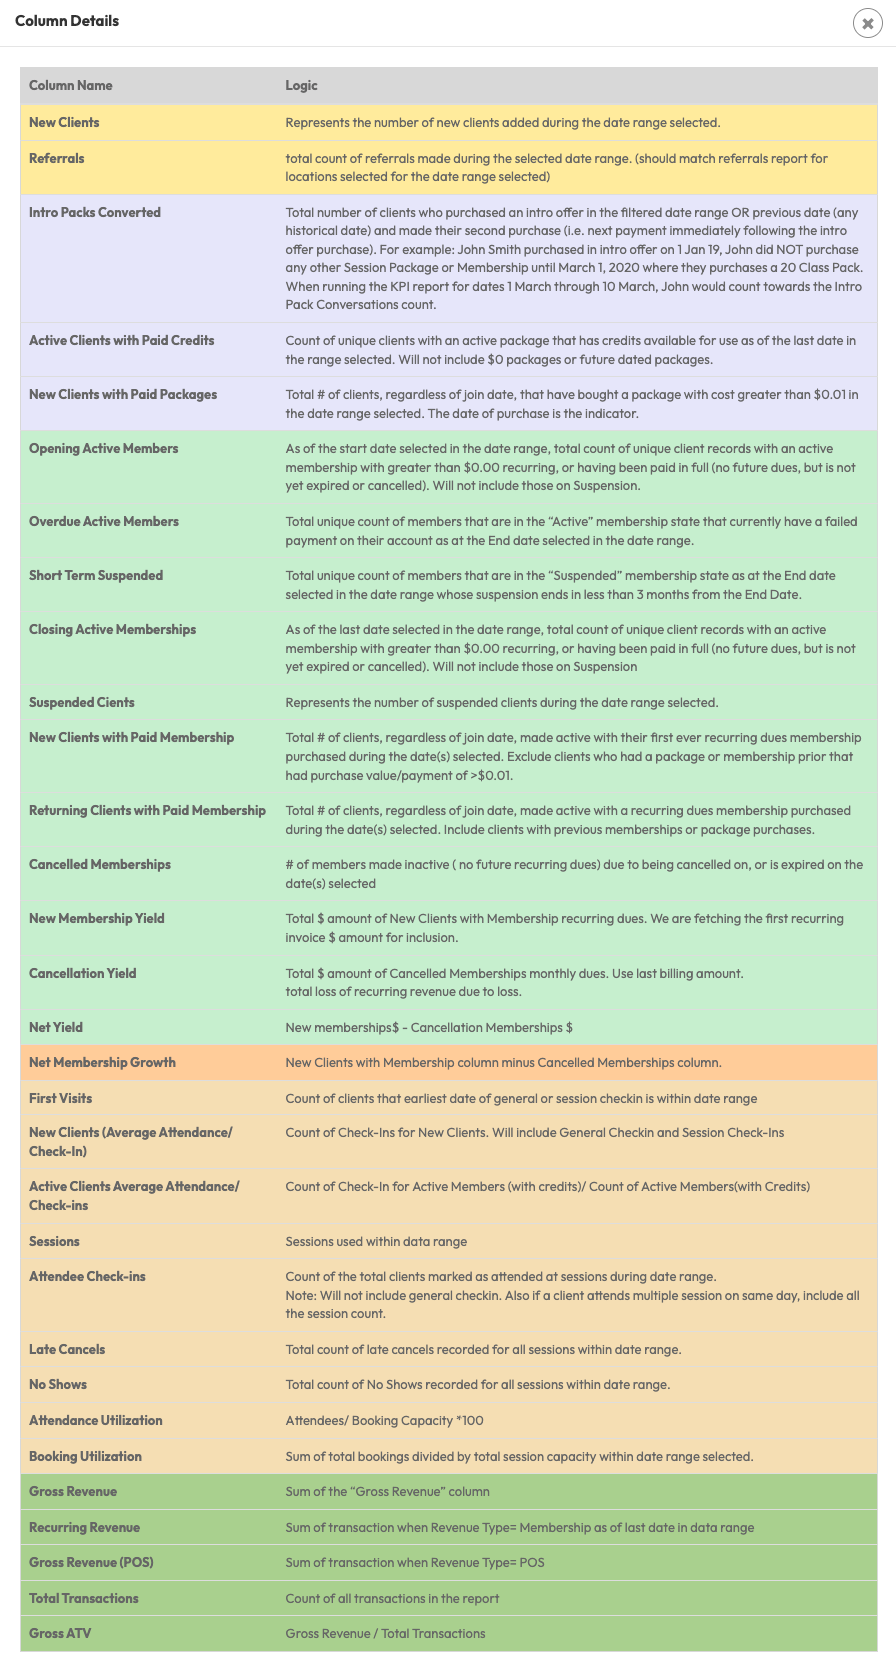
Column Details in a table:
| Column Name | Logic |
|---|---|
| New Clients | Represents the number of new clients added during the date range selected. |
| Referrals | total count of referrals made during the selected date range. (should match referrals report for locations selected for the date range selected) |
| Intro Packs Converted | Total number of clients who purchased an intro offer in the filtered date range OR previous date (any historical date) and made their second purchase (i.e. next payment immediately following the intro offer purchase). For example: John Smith purchased in intro offer on 1 Jan 19, John did NOT purchase any other Session Package or Membership until March 1, 2020 where they purchases a 20 Class Pack. When running the KPI report for dates 1 March through 10 March, John would count towards the Intro Pack Conversations count. |
| Active Clients with Paid Credits | Count of unique clients with an active package that has credits available for use as of the last date in the range selected. Will not include $0 packages or future dated packages. |
| New Clients with Paid Packages | Total # of clients, regardless of join date, that have bought a package with cost greater than $0.01 in the date range selected. The date of purchase is the indicator. |
| Opening Active Members | As of the start date selected in the date range, total count of unique client records with an active membership with greater than $0.00 recurring, or having been paid in full (no future dues, but is not yet expired or cancelled). Will not include those on Suspension. |
| Overdue Active Members | Total unique count of members that are in the “Active” membership state that currently have a failed payment on their account as at the End date selected in the date range. |
| Short Term Suspended | Total unique count of members that are in the “Suspended” membership state as at the End date selected in the date range whose suspension ends in less than 3 months from the End Date. |
| Closing Active Memberships | As of the last date selected in the date range, total count of unique client records with an active membership with greater than $0.00 recurring, or having been paid in full (no future dues, but is not yet expired or cancelled). Will not include those on Suspension |
| Suspended Cients | Represents the number of suspended clients during the date range selected. |
| New Clients with Paid Membership | Total # of clients, regardless of join date, made active with their first ever recurring dues membership purchased during the date(s) selected. Exclude clients who had a package or membership prior that had purchase value/payment of >$0.01. |
| Returning Clients with Paid Membership | Total # of clients, regardless of join date, made active with a recurring dues membership purchased during the date(s) selected. Include clients with previous memberships or package purchases. |
| Cancelled Memberships | # of members made inactive ( no future recurring dues) due to being cancelled on, or is expired on the date(s) selected |
| New Membership Yield | Total $ amount of New Clients with Membership recurring dues. We are fetching the first recurring invoice $ amount for inclusion. |
| Cancellation Yield | Total $ amount of Cancelled Memberships monthly dues. Use last billing amount. total loss of recurring revenue due to loss. |
| Net Yield | New memberships$ - Cancellation Memberships $ |
| Net Membership Growth | New Clients with Membership column minus Cancelled Memberships column. |
| First Visits | Count of clients that earliest date of general or session checkin is within date range |
| New Clients (Average Attendance/ Check-In) | Count of Check-Ins for New Clients. Will include General Checkin and Session Check-Ins |
| Active Clients Average Attendance/ Check-ins | Count of Check-In for Active Members (with credits)/ Count of Active Members(with Credits) |
| Sessions | Sessions used within data range |
| Attendee Check-ins | Count of the total clients marked as attended at sessions during date range. Note: Will not include general checkin. Also if a client attends multiple session on same day, include all the session count. |
| Late Cancels | Total count of late cancels recorded for all sessions within date range. |
| No Shows | Total count of No Shows recorded for all sessions within date range. |
| Attendance Utilization | Attendees/ Booking Capacity *100 |
| Booking Utilization | Sum of total bookings divided by total session capacity within date range selected. |
| Gross Revenue | Sum of the “Gross Revenue” column |
| Recurring Revenue | Sum of transaction when Revenue Type= Membership as of last date in data range |
| Gross Revenue (POS) | Sum of transaction when Revenue Type= POS |
| Total Transactions | Count of all transactions in the report |
| Gross ATV | Gross Revenue / Total Transactions |
FAQ
Q: Can I customize what metrics are shown?
A: Yes! Use the Edit Report Settings button to select which KPI fields to display.
Need help or something not working as expected?
Reach out to our support team via [email protected].

