 262
262
Overview
The Attendance by Session Type report gives you a clear picture of how different types of sessions are performing at your business. It compares the number of sessions offered against the actual number of attendees for each session type over the last 6 months.
This report helps you see which sessions are most popular, where attendance may be lower, and how to adjust scheduling to match client demand.
Access the Attendance by Session Type Report
1. Navigate to Reports
-
Log in to Core
-
Click Reports from the Navigation bar
-
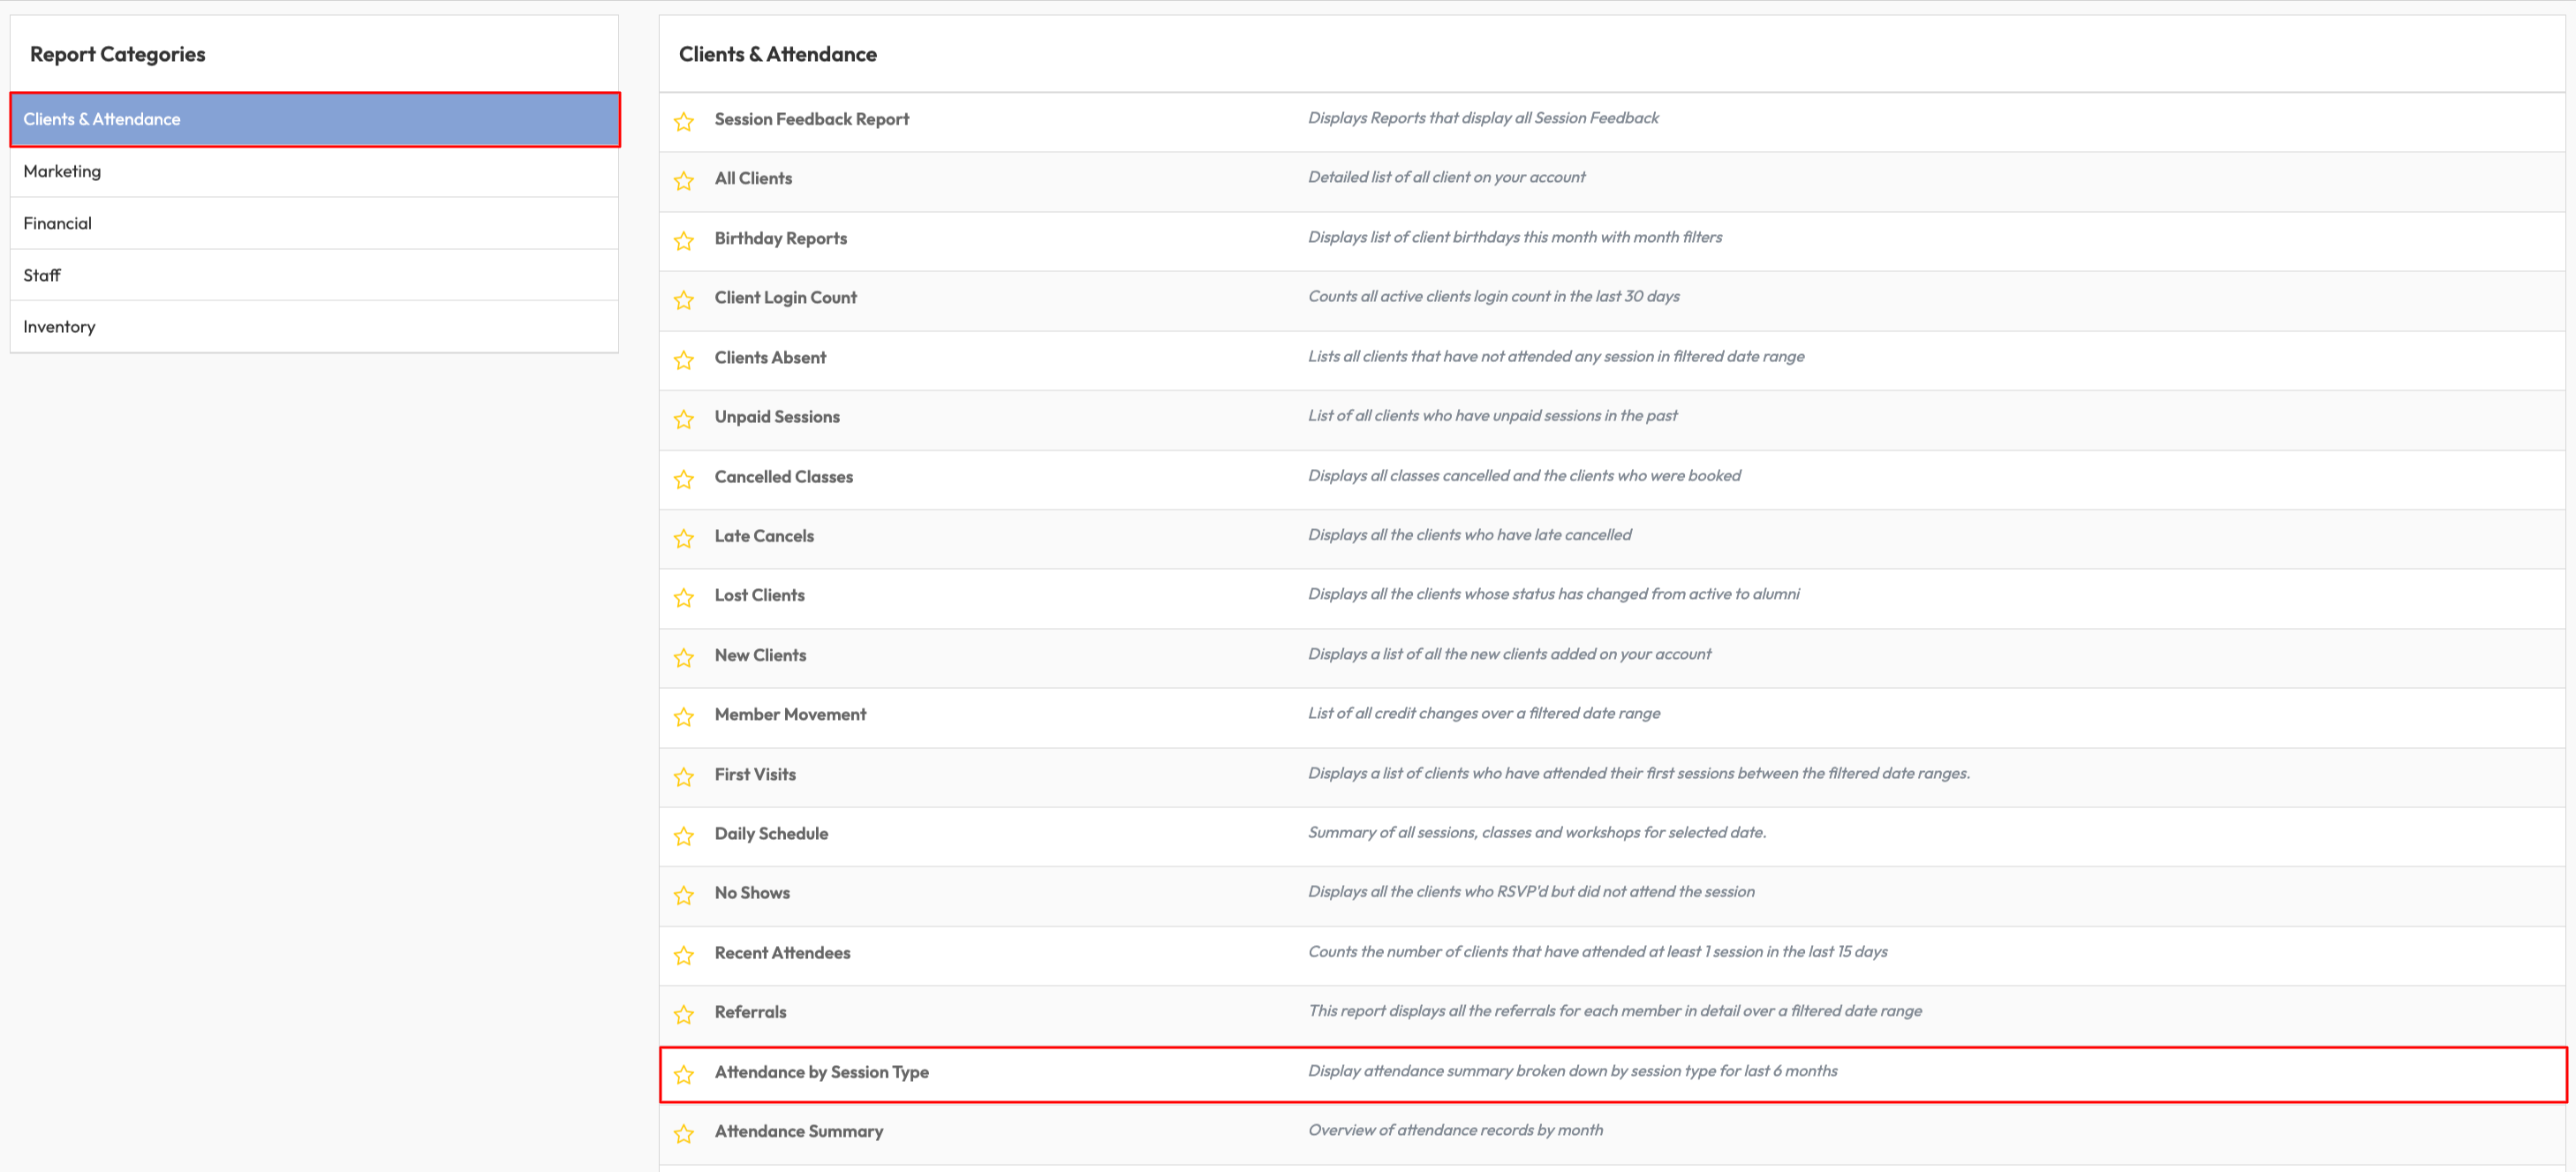
Within the Clients & Attendance Report Category, select Access by Session Type report
-
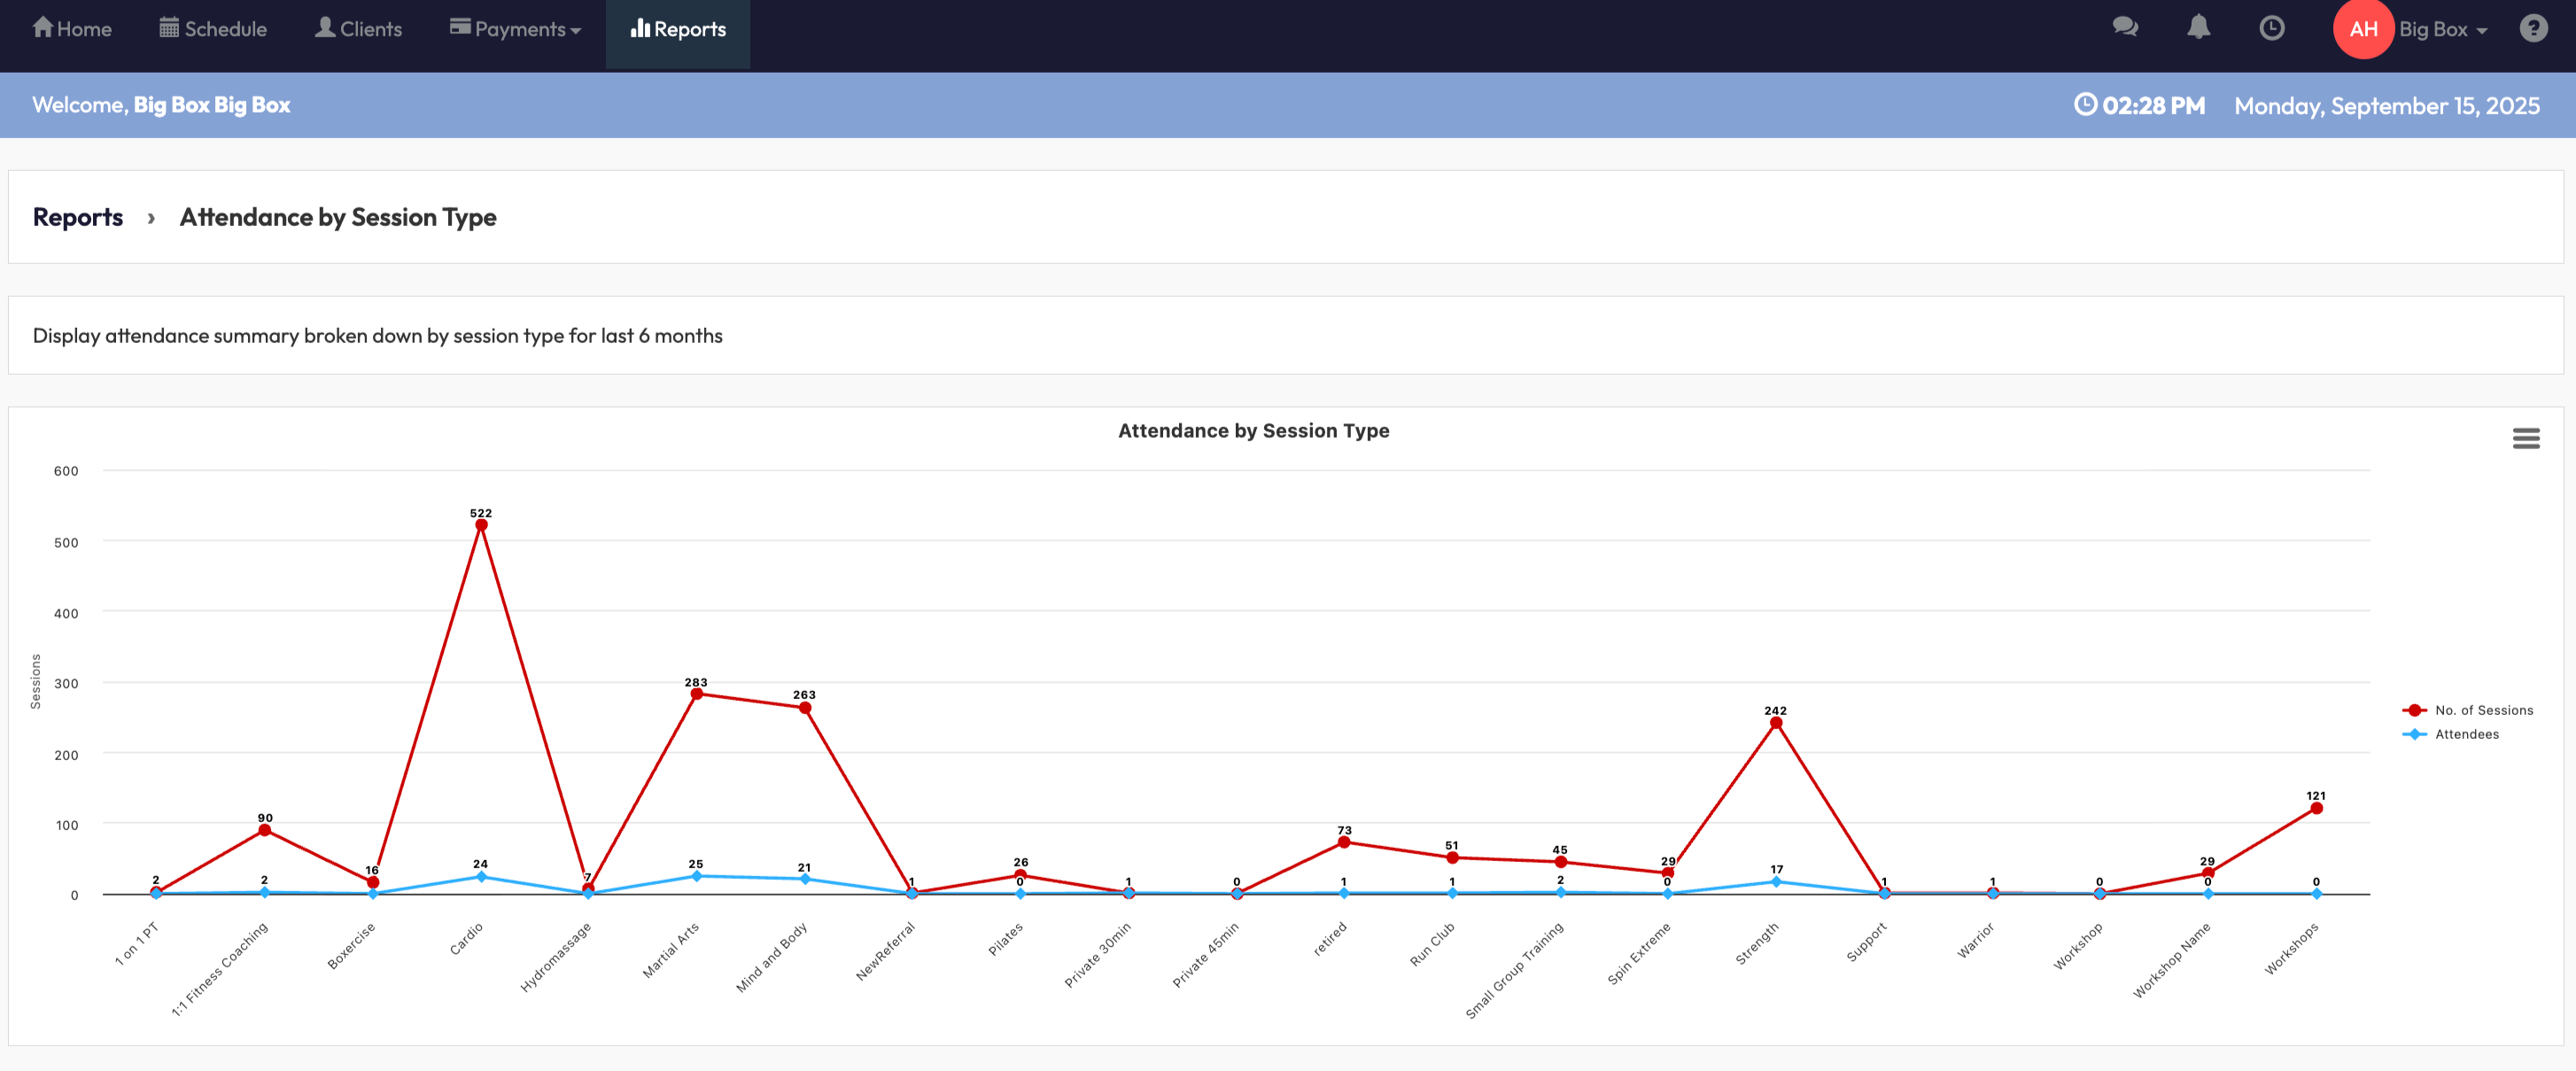
The report automatically generates a graph covering the last 6 months.
Tip: No filters are needed - this report is fixed to always show the past 6 months.

2. Review the Graph
-
The X-axis shows session types (e.g. Yoga, Cardio, Pilates).
-
The Y-axis shows the count of sessions and attendees.
-
Red line = number of sessions offered.
-
Blue line = number of attendees who checked in.

3. Use the Insights
-
Spot which session types are most popular.
-
Identify under-performing session types where attendance is low.
-
Adjust scheduling or promotions based on attendance trends.
Expected Outcome
By running this report, you’ll know which session types attract the most clients and which may need changes in scheduling, marketing, or instructor support. This helps you boost engagement and make smarter business decisions.
FAQ
Q: Can I change the 6-month date range?
A: No, this report is fixed to the last 6 months to keep analysis consistent.
Q: Why don’t I see some session types?
A: Only session types with scheduled sessions in the past 6 months are shown.
Q: Does it count no-shows?
A: No, only clients marked with attendance as “Yes” are included.
Reach out to our support team via [email protected] if you need help.


