
 301
301
Overview
The Attendance Summary report gives you a clear month-by-month breakdown of attendance activity over the last 6 months. It shows the total number of scheduled sessions, client reservations, actual attendees, and no-shows.
This report is especially useful for spotting seasonal patterns, understanding overall facility utilization, and tracking how bookings compare with actual attendance. With this insight, you can plan better schedules, improve attendance, and reduce no-shows.
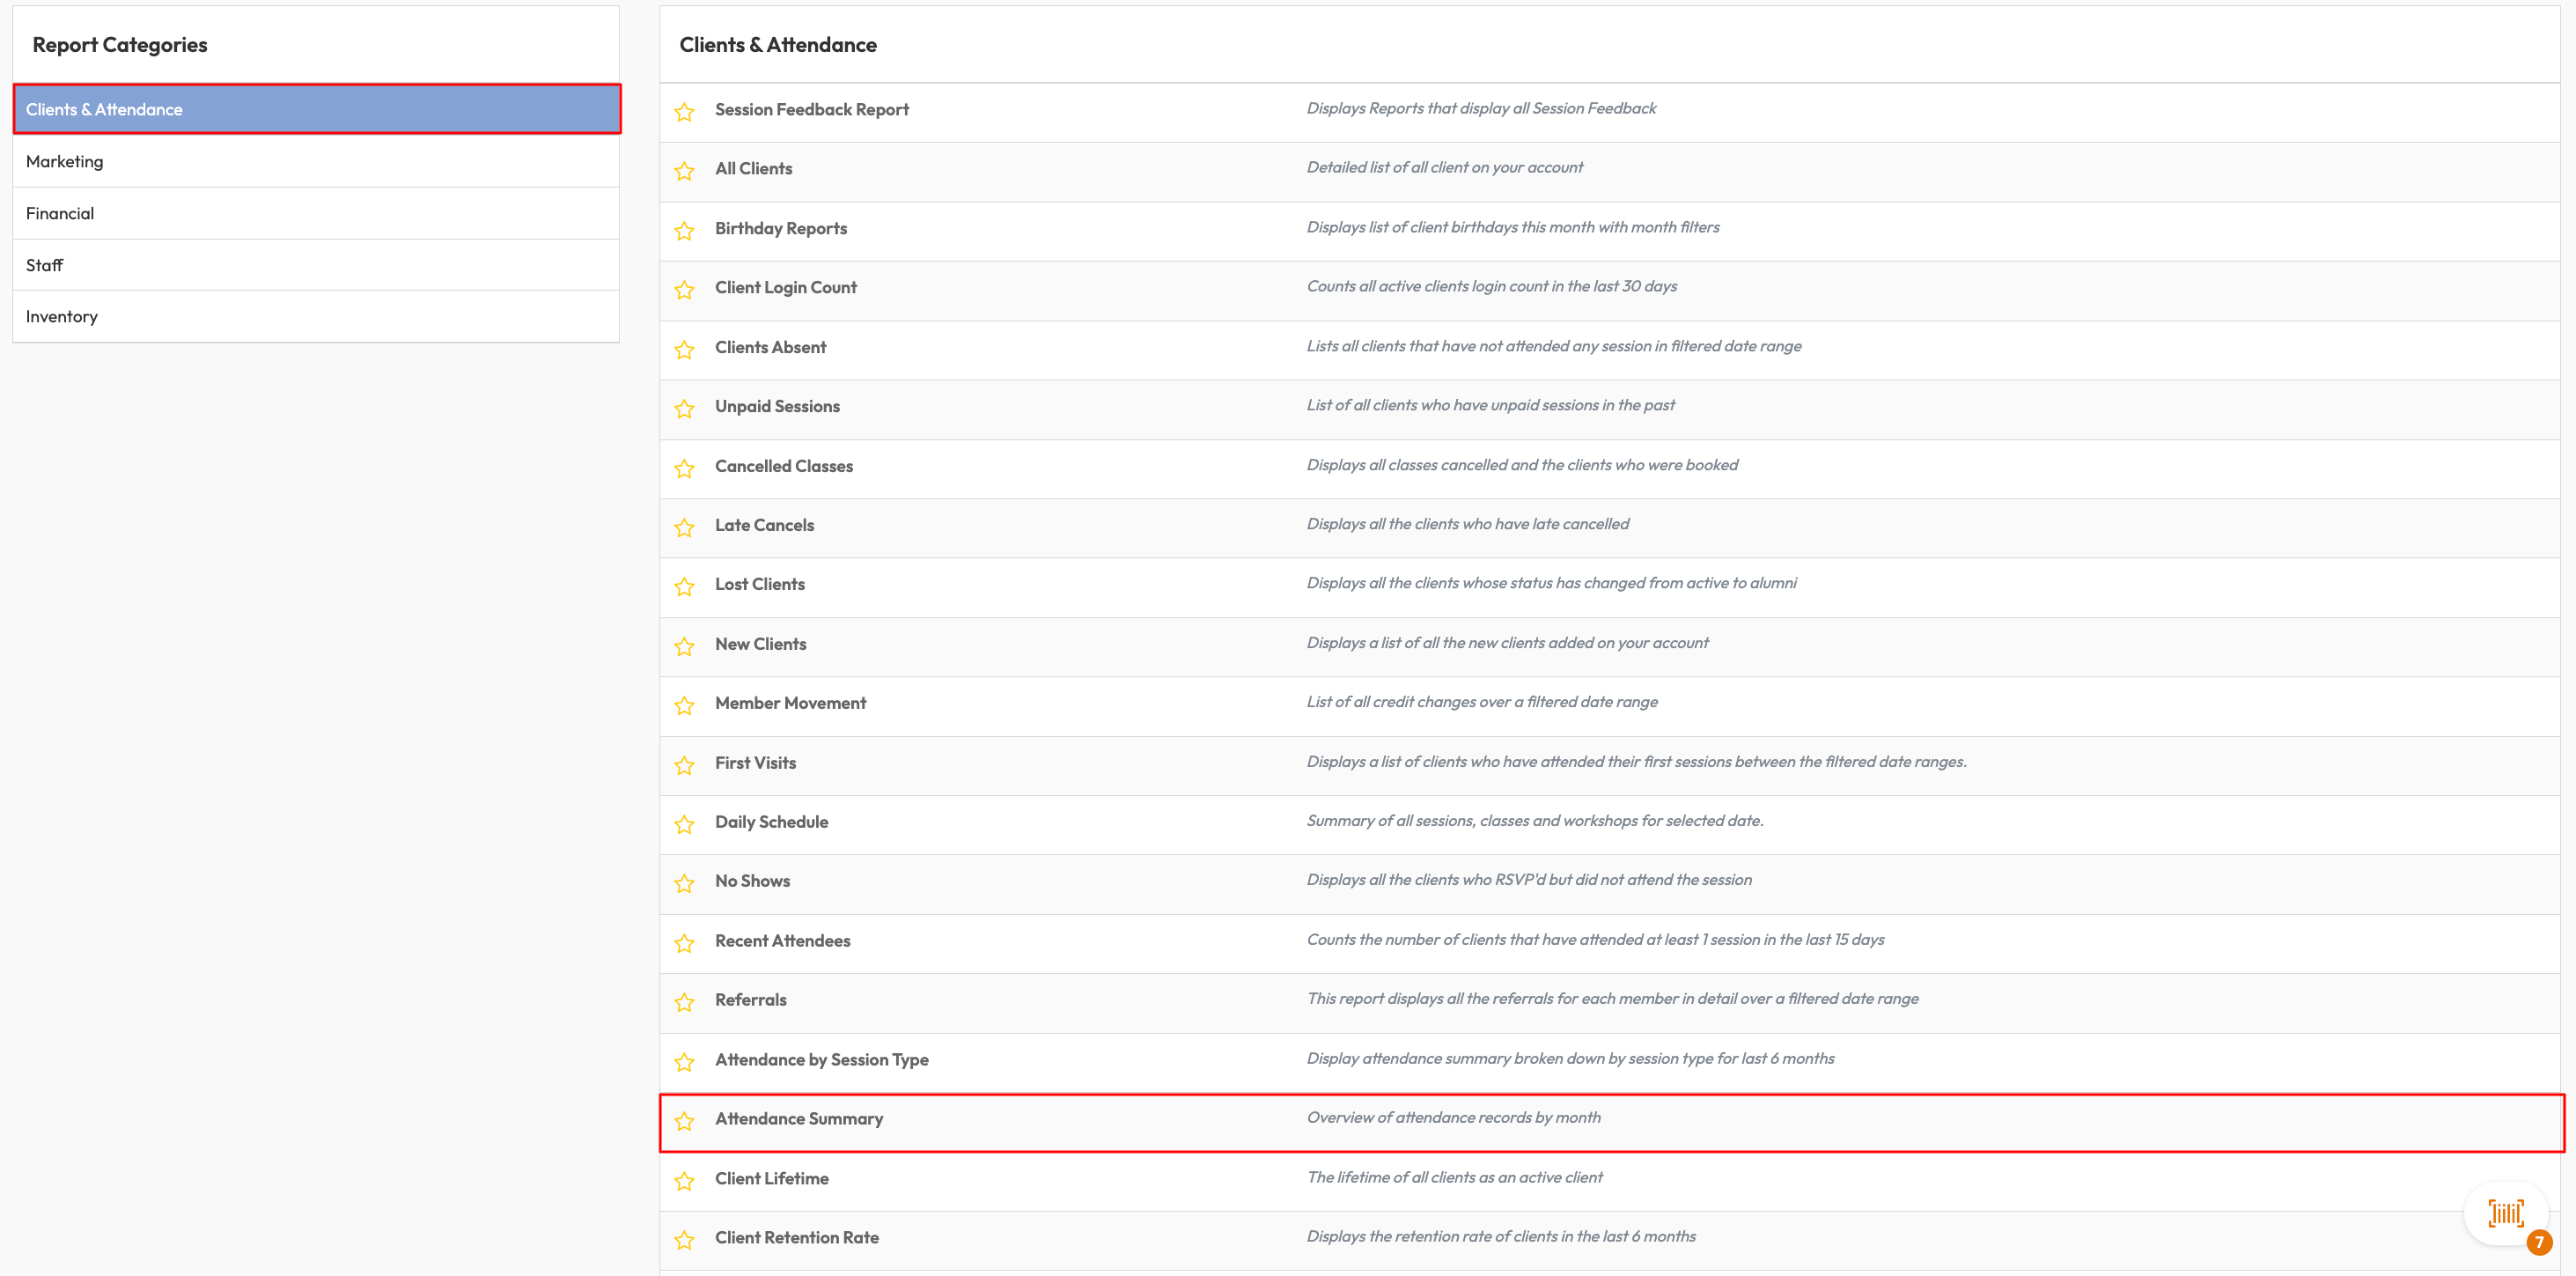
Access the Attendance Summary Report
1. Navigate to Reports
-
Log in to Core
-
Click Reports from the Navigation bar
-
Within the Clients & Attendance Report Category, select Attendance Summary report
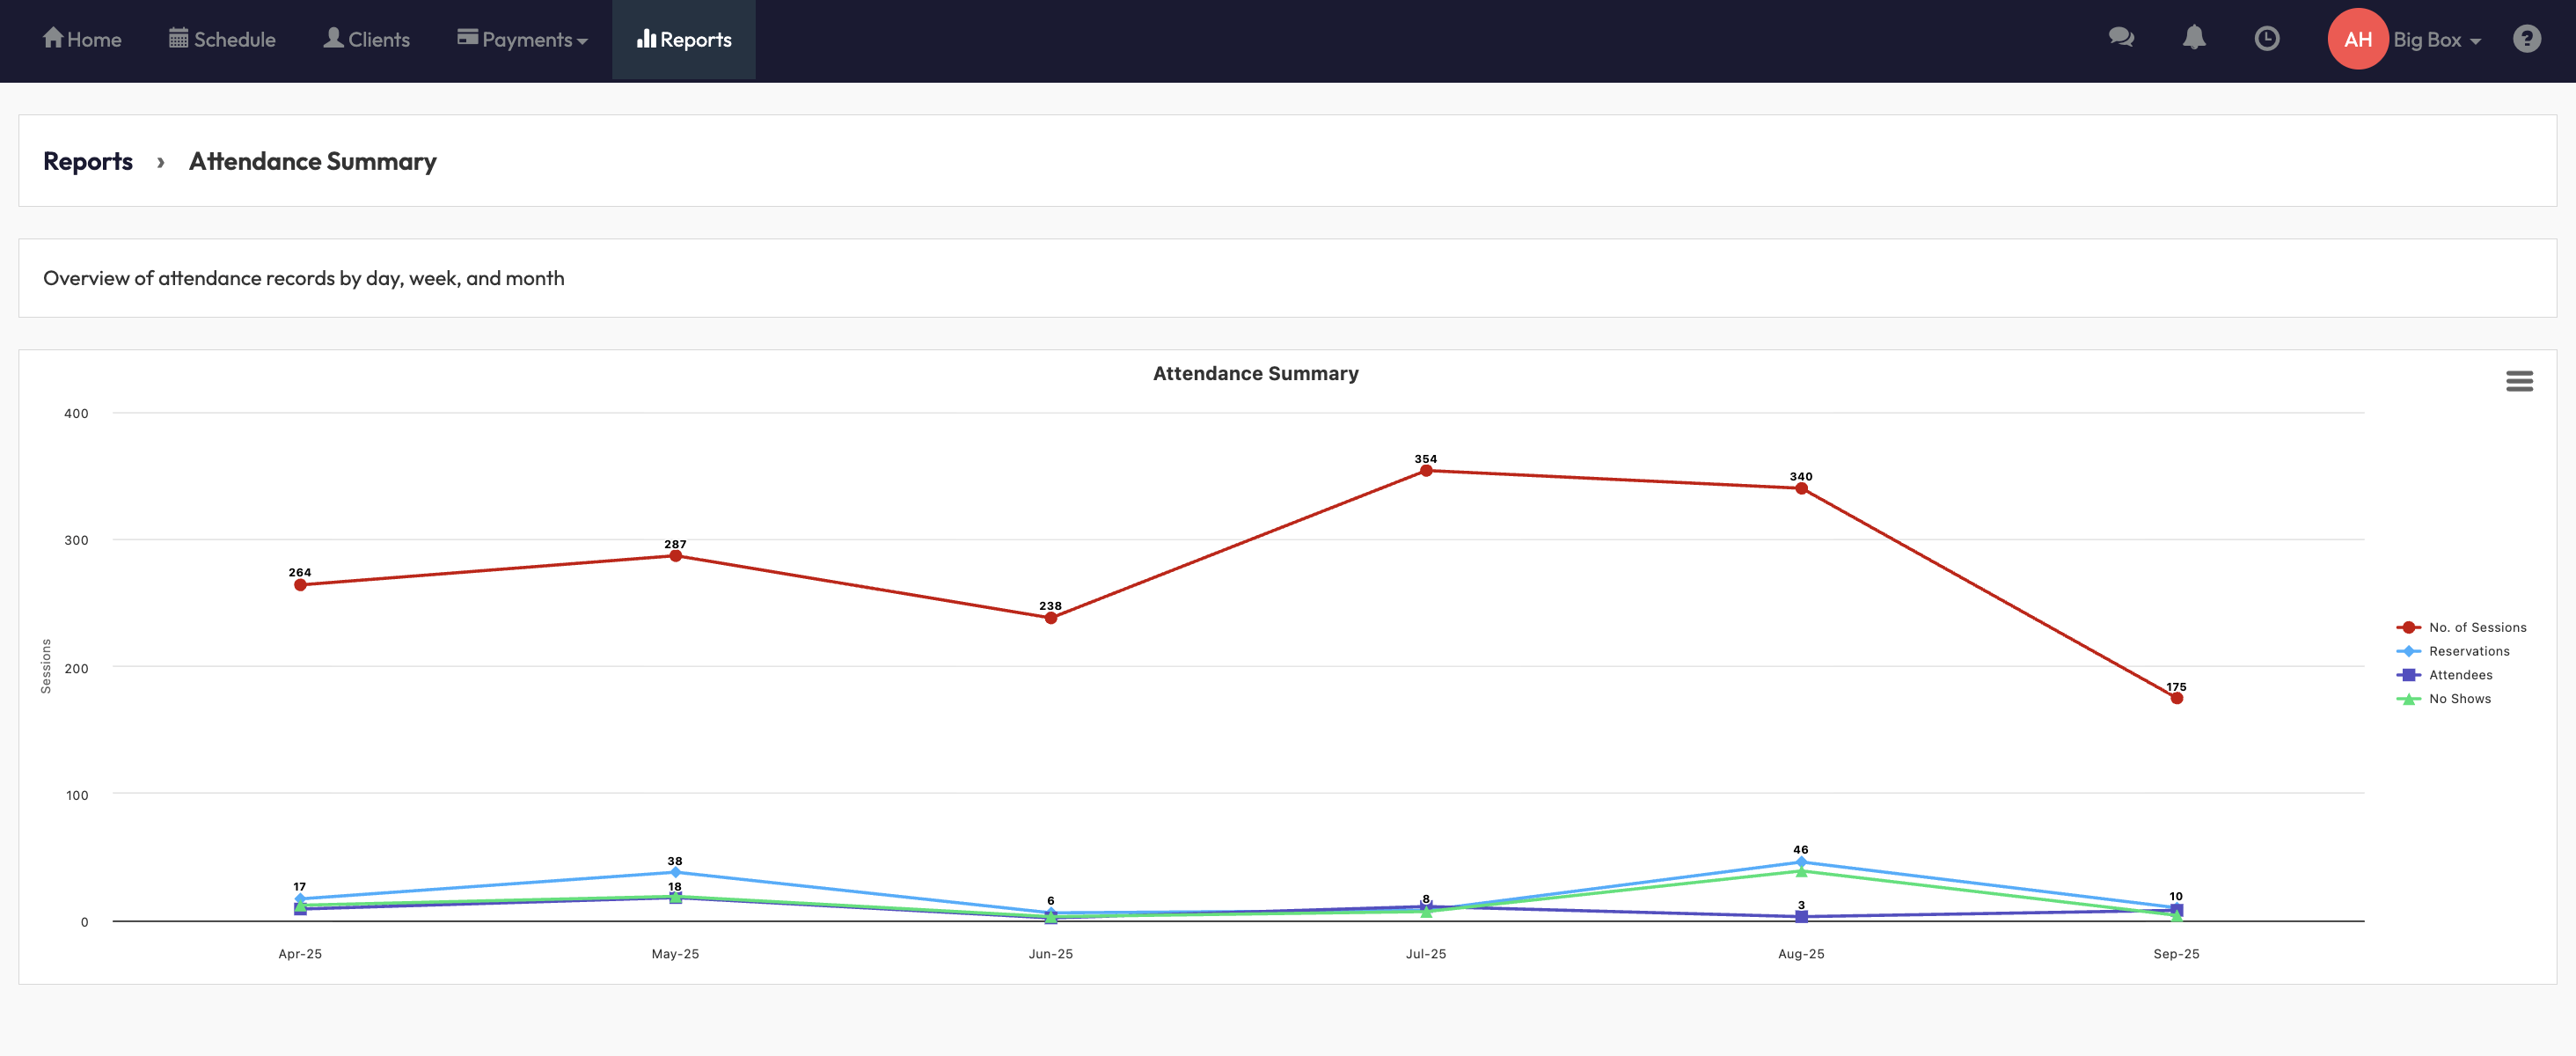
2. Review the Graph
-
The report automatically displays the last 6 months of data.
-
Review the chart, which includes:
-
No. of Sessions (red line): total scheduled sessions.
-
Reservations (blue line): client bookings made.
-
Attendees (purple line): actual clients who attended.
-
No Shows (green line): clients who booked but didn’t attend.
-
3. Analyze Trends
-
Use the chart to spot patterns in attendance and no-shows.
-
Compare sessions offered vs. attendance to see if you’re under- or over-scheduling.
-
Look for seasonal peaks (e.g. January growth, summer slowdowns).
Tip: Share these insights with your team during monthly planning sessions to optimize scheduling and improve engagement.
Expected Outcome
By following these steps, you’ll be able to:
-
Track attendance, reservations, and no-shows month-by-month.
-
Identify trends in engagement and seasonality.
-
Make informed decisions about class schedules and capacity planning.
FAQ
Q: Can I change the date range for this report?
A: No, this report is fixed to the last 6 months. For custom date ranges, use other attendance reports in Hapana.
Q: How are no-shows calculated?
A: No-shows are calculated as the difference between reservations and actual attendance.
Reach out to our support team via [email protected] if you need help.

