
 141
141
Overview
The Gender and Age Group Report shows a clear breakdown of your client base by gender and age range. This helps you understand the demographic makeup of your members so you can make smarter decisions about marketing, programming, and member engagement.
With this report, you can see how many male and female clients fall into each age category, giving you insights into who you’re serving today and where you may want to focus future growth.
Access the Gender and Age Group Report
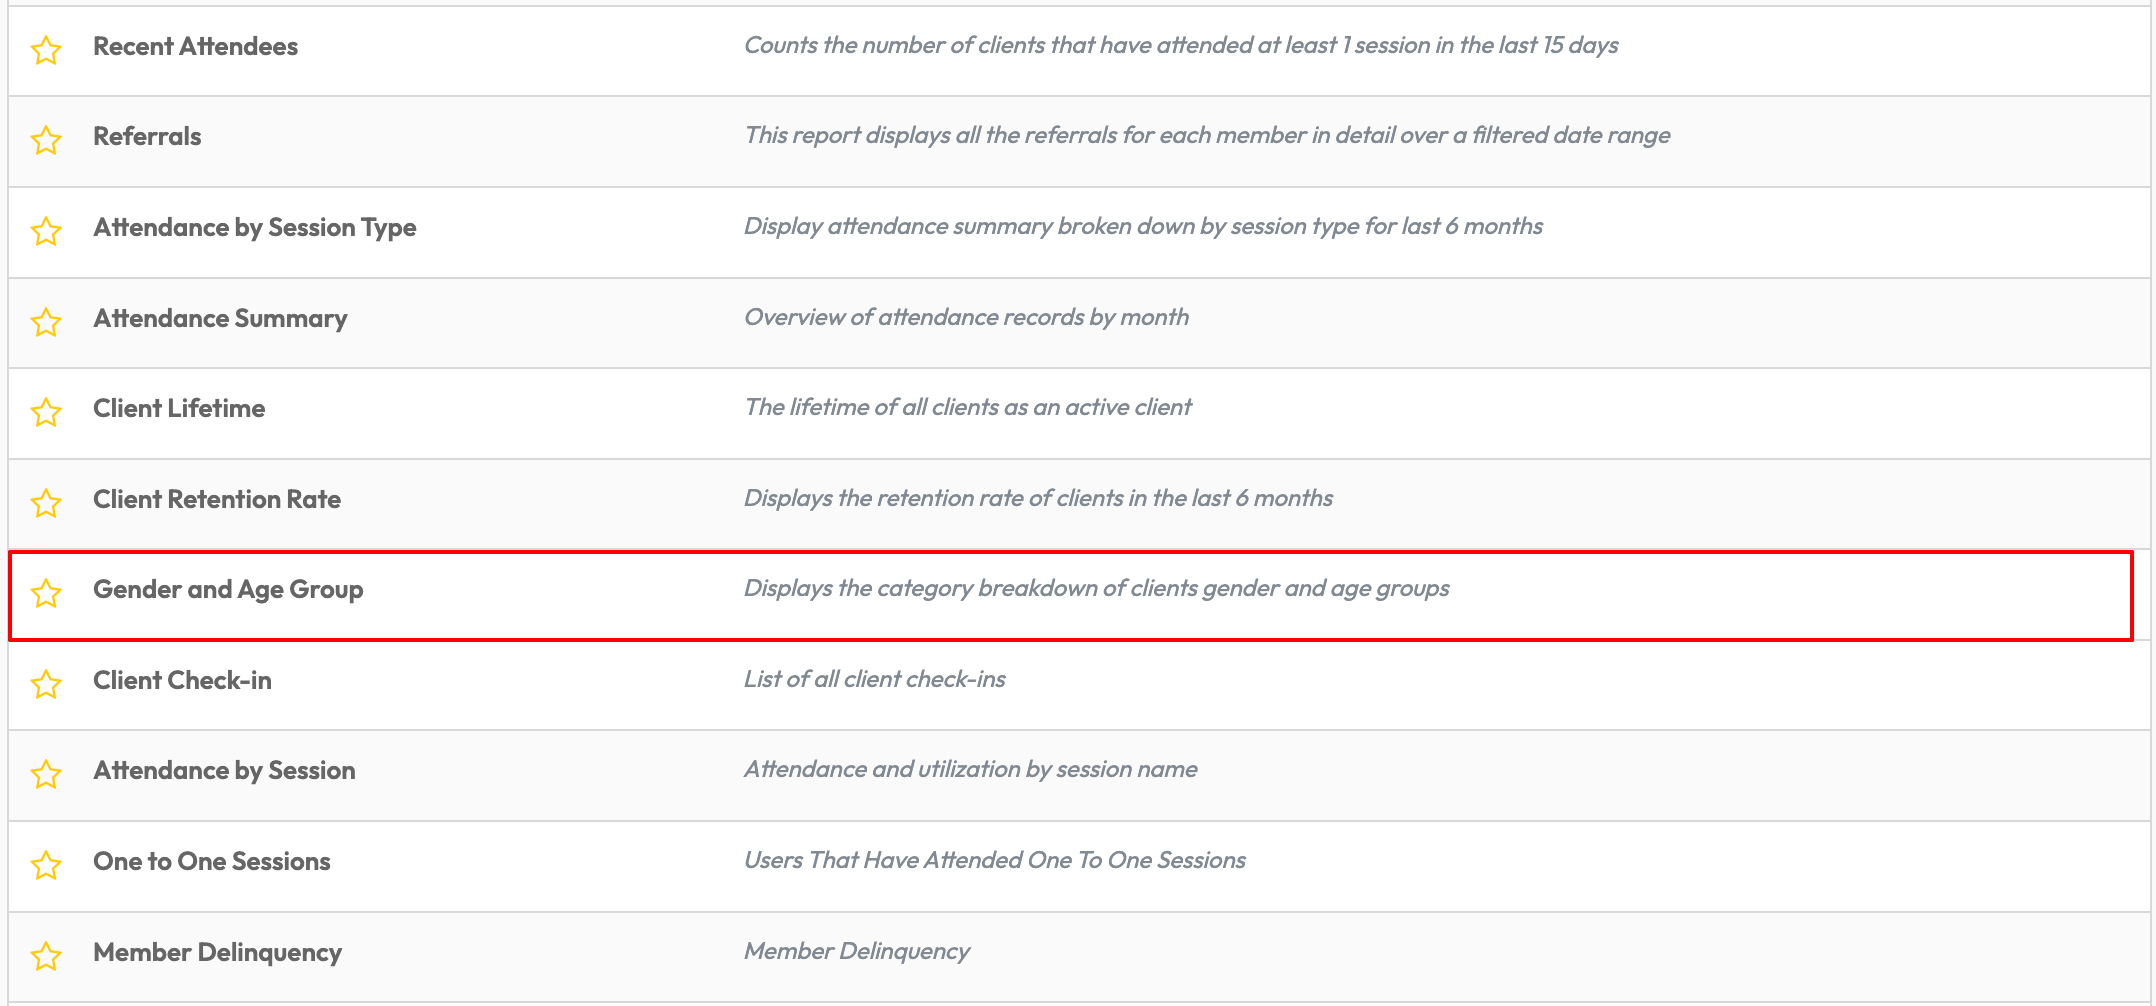
1. Navigate to Reports
-
Log in to Core
-
Click Reports from the Navigation bar
-
Within the Clients & Attendance Report Category, select Gender and Age Group Report
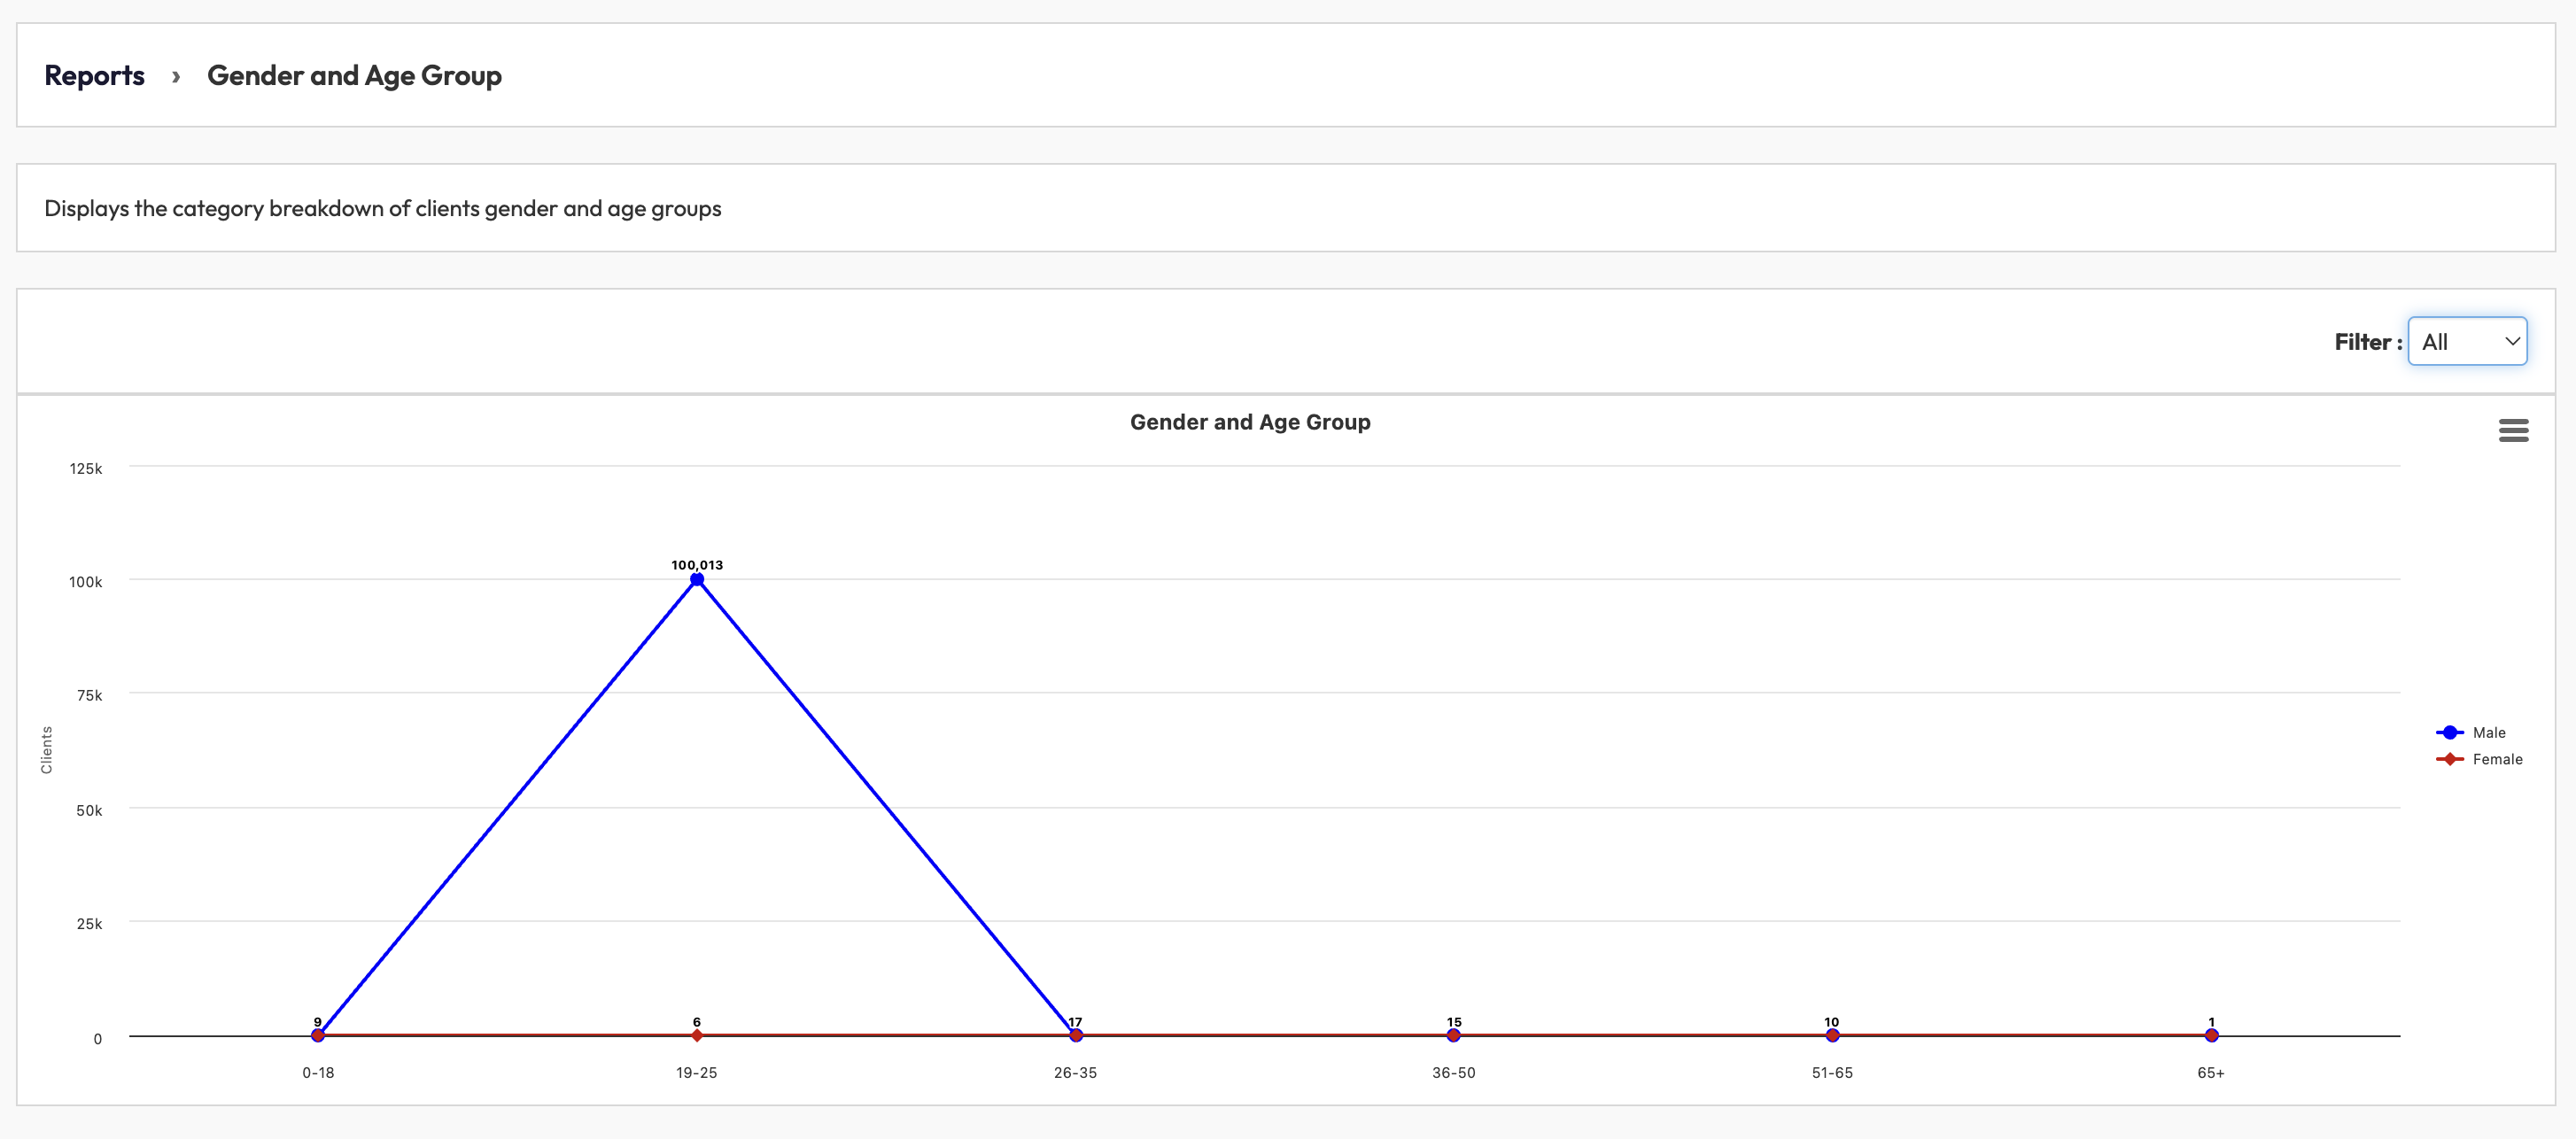
2. Apply Filters
-
Use the Filter dropdown to refine your view.
-
Choose All, Active, or Alumni to focus on specific client statuses.
-
-
The chart will automatically update based on your filter selection.
3. Interpret the Chart
-
The X-axis shows predefined age groups: 0–18, 19–25, 26–35, 36–50, 51–65, 65+.
-
The Y-axis shows the number of clients in each group.
-
Blue line = Male clients.
-
Red line = Female clients.
Expected Outcome
By following these steps, you’ll see a clear chart showing the distribution of your clients across gender and age groups. This data can be used to:
-
Shape your class offerings to suit the largest groups.
-
Target marketing campaigns more effectively.
-
Track demographic changes in your client base over time.
FAQ
Q: Why do some age groups show zero clients?
A: This means no clients in your system meet the criteria for that age group and gender.
Q: Can I export this data?
A: Yes, use the download icon in the top-right of the report to export results.
Q: How is age calculated?
A: Age is calculated using the client’s date of birth entered in their profile.
Need help? Reach out to our support team via [email protected].

