
 171
171
Overview
The Lead Sources Report gives you a visual summary of where your leads are coming from and how well each source converts into active clients.
This report compares total leads acquired and converted leads across all lead sources, helping you identify which marketing channels deliver the best results.
Use this data to focus your marketing spend on high-performing sources and discover where there’s room to improve conversions.
Prerequisites
-
You must have access to the Reports module.
-
Lead sources must already be configured in your system (e.g. Social Media, Referral, Advertisement).
-
Ensure you have recorded lead and conversion data.
Access the Lead Sources Report
1. Navigate to Reports
-
Log in to Core
-
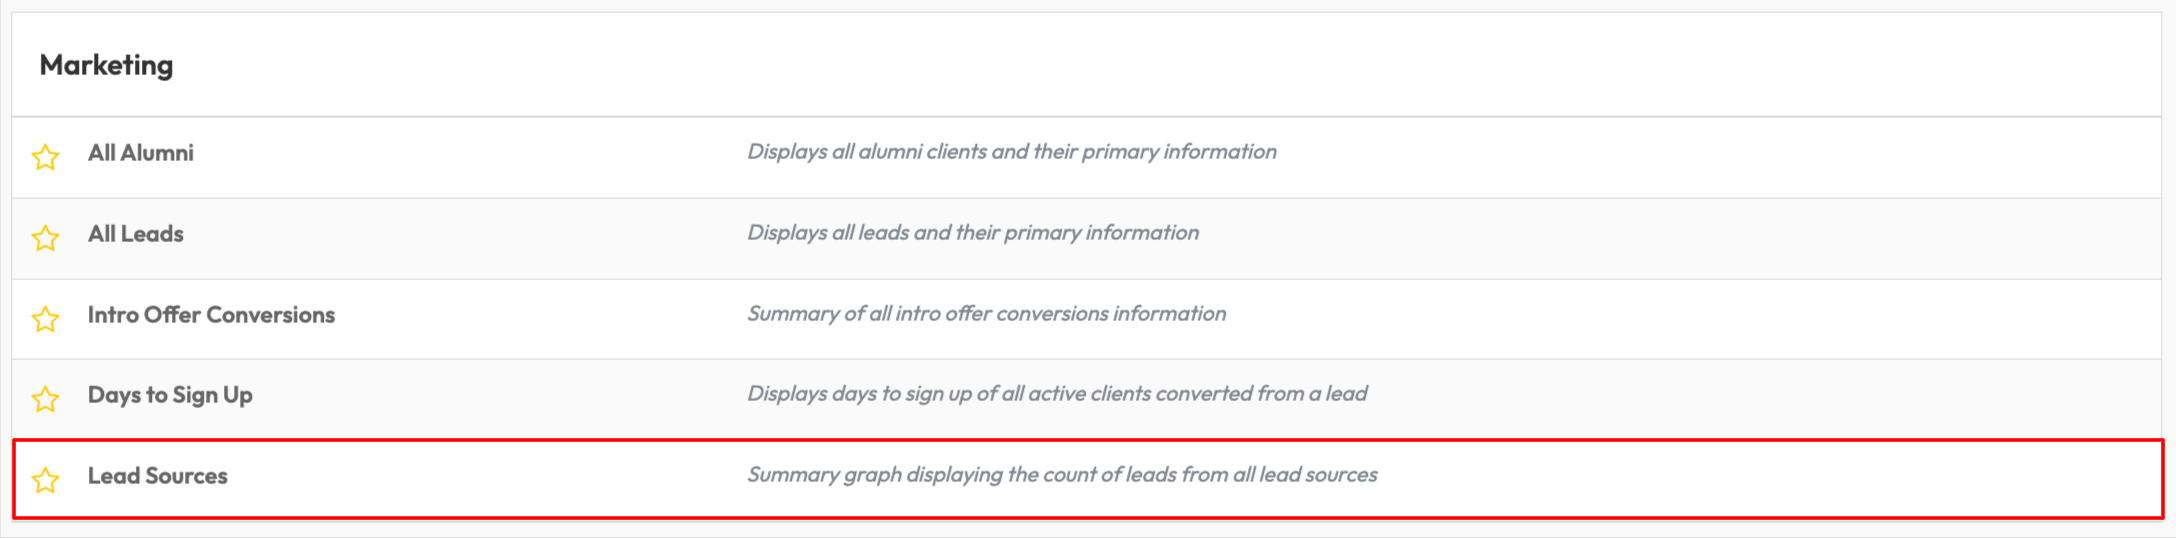
Click Reports from the Navigation bar
-
Within the Marketing Category, select Lead Sources
2. Review the Graph Summary
-
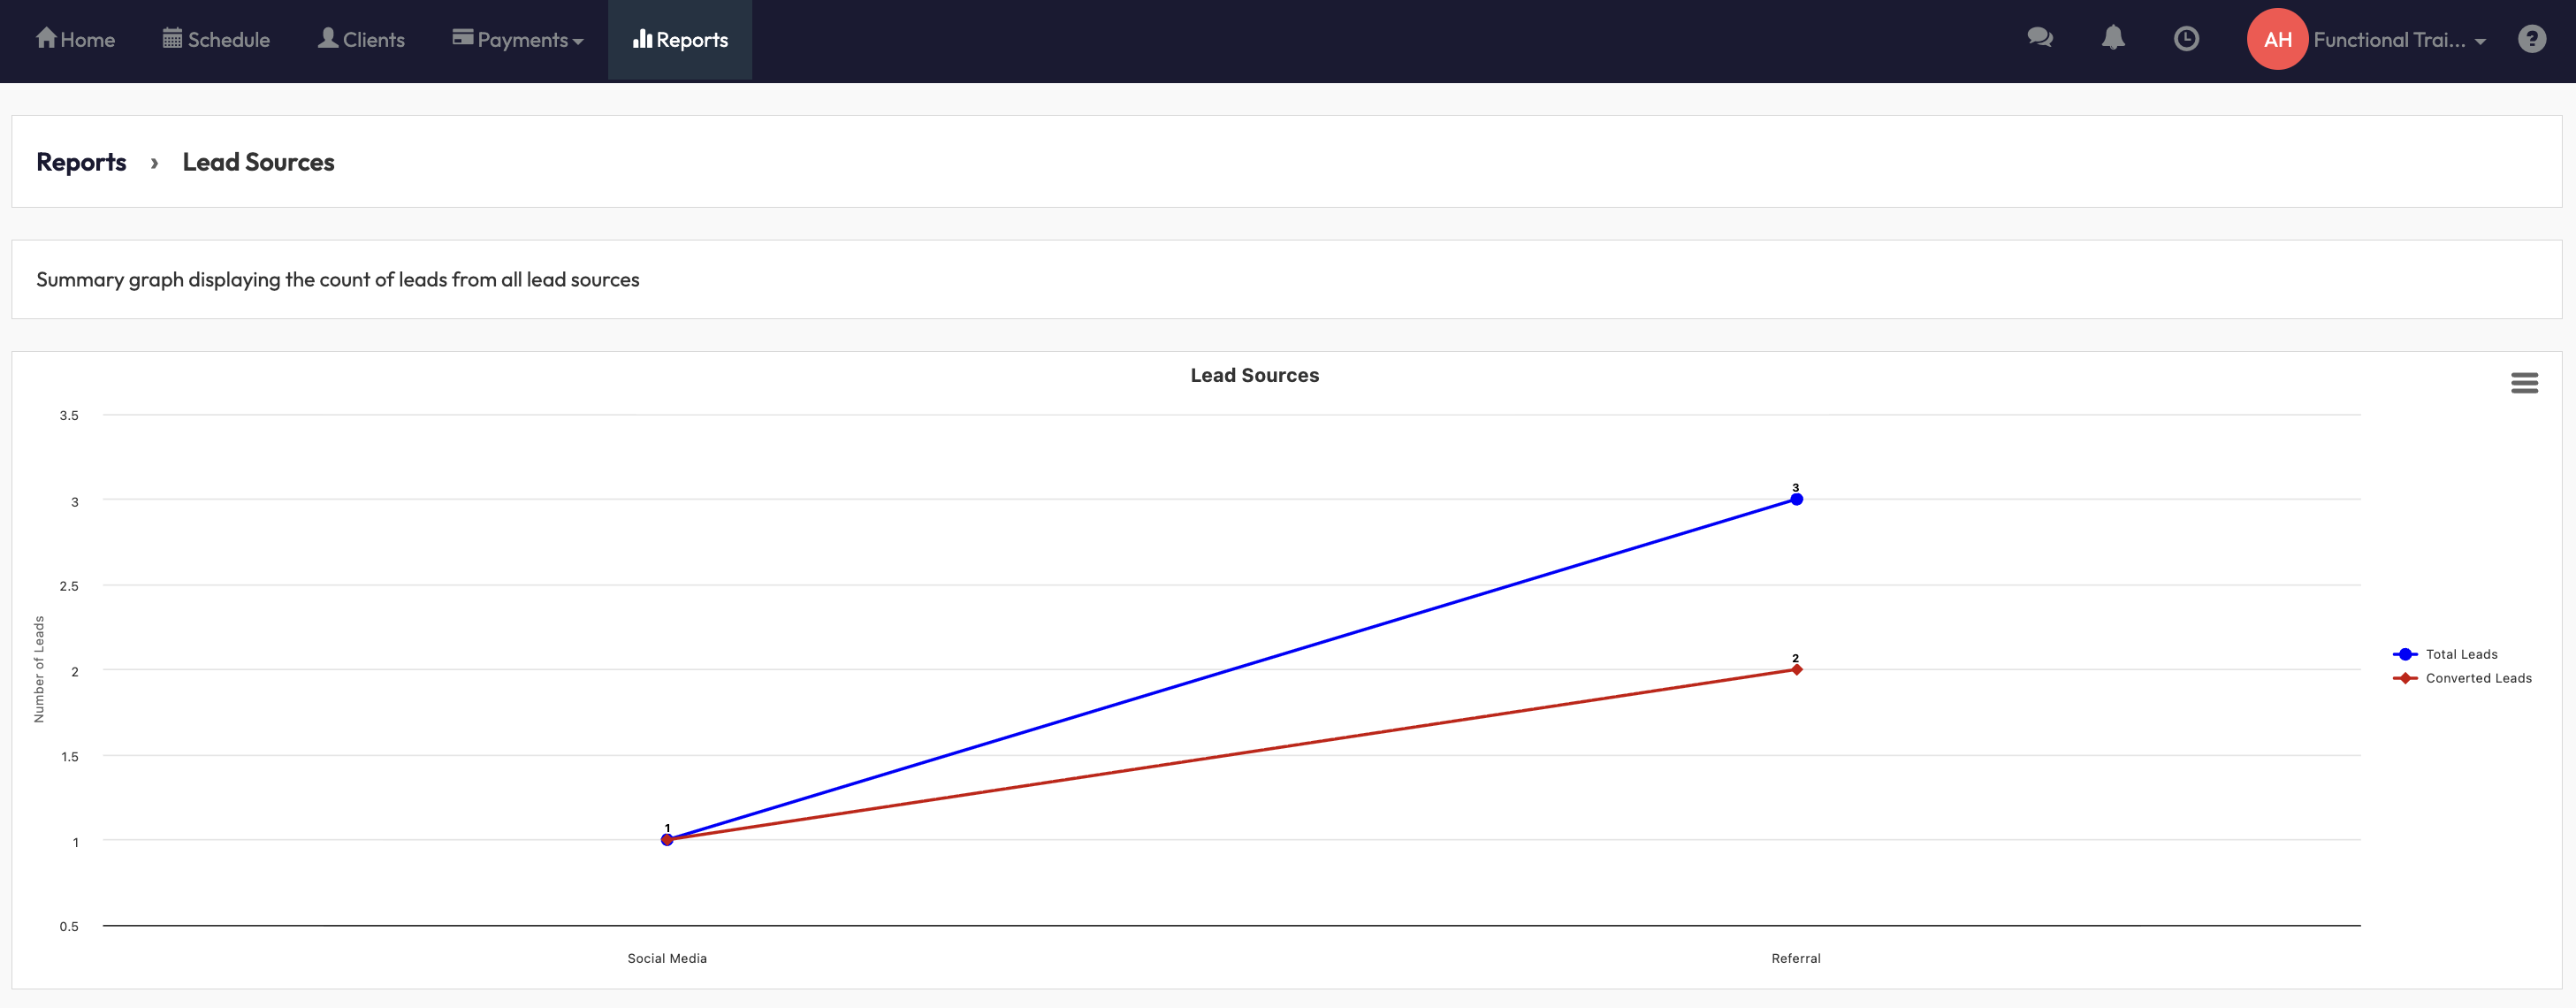
The report automatically loads a summary chart displaying all lead sources.
-
The X-axis shows the different lead sources (e.g. Referral, Social Media, Advertisement).
-
The Y-axis shows the number of leads.
-
The graph includes two key data series:
-
Blue Line - Total Leads: all leads captured from that source.
-
Red Line - Converted Leads: leads that became active clients.
-
3. Understand What the Data Shows
-
Social Media: measures performance from social platforms and paid campaigns.
-
Word of Mouth: includes referrals and organic recommendations.
-
Referral: includes formal referrals and organic word-of-mouth leads.
-
Advertisement: includes paid advertising campaigns.
-
Search Engine: organic and paid search results.
-
Client Registered by Self: counts self-registrations directly in the app or web.
-
Custom Sources: any additional lead sources set up by your business.
This comparison helps you pinpoint which channels generate the most leads and which ones deliver the best conversion rates.
Expected Outcome
After viewing this report, you’ll be able to:
-
Identify the most effective lead sources for both acquisition and conversion.
-
Compare performance across marketing channels.
-
Make informed decisions about where to focus marketing and sales efforts.
FAQs
Q. Can I filter this report by date or location?
A. No. The Lead Sources report includes all leads across all time periods for a full historical view.
Q. What do the colored lines mean?
A. The blue line represents total leads, and the red line represents converted leads.
Q. Can I download this graph?
A. Yes. Click the download icon in the top-right corner of the report to save or share the chart.
Need more help?
Reach out to our support team via [email protected].

